Home /
Expert Answers /
Civil Engineering /
problem5-consider-the-simple-storm-sewer-system-shown-in-figure-below-the-basic-subarea-and-stor-pa652
(Solved): Problem5: Consider the simple storm sewer system shown in figure below. The basic subarea and stor ...
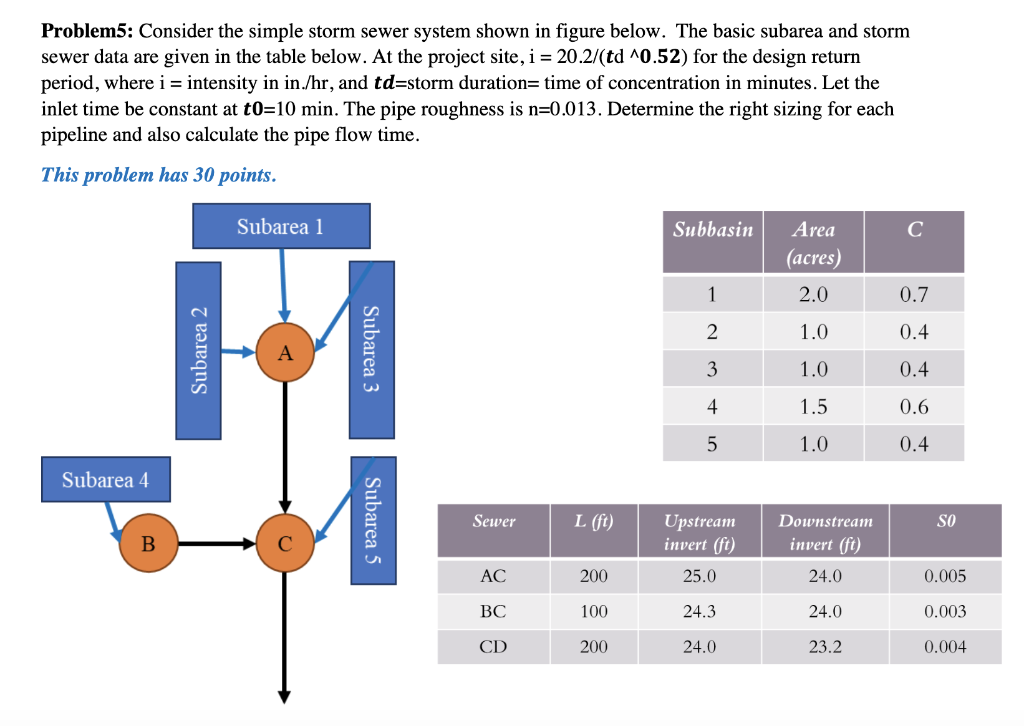
Problem5: Consider the simple storm sewer system shown in figure below. The basic subarea and storm sewer data are given in the table below. At the project site, \( \mathrm{i}=20.2 /\left(\boldsymbol{t d}{ }^{\wedge} \mathbf{0 . 5 2}\right) \) for the design return period, where \( \mathrm{i}= \) intensity in in. \( / \mathrm{hr} \), and \( \boldsymbol{t d}= \) storm duration= time of concentration in minutes. Let the inlet time be constant at \( \boldsymbol{t 0}=10 \mathrm{~min} \). The pipe roughness is \( \mathrm{n}=0.013 \). Determine the right sizing for each pipeline and also calculate the pipe flow time. This problem has 30 points.
Expert Answer
Given that, let a will receive water from both subarea 1 and subarea 2. peak flow Q=CIA where c is runoff coefficient i is intensity in in/hr A is are
