Home /
Expert Answers /
Chemistry /
problem-1-4-consider-the-following-density-temperature-phase-diagram-of-benzene-using-the-follow-pa270
(Solved): Problem 1.4. Consider the following density-temperature phase diagram of benzene: Using the follow ...
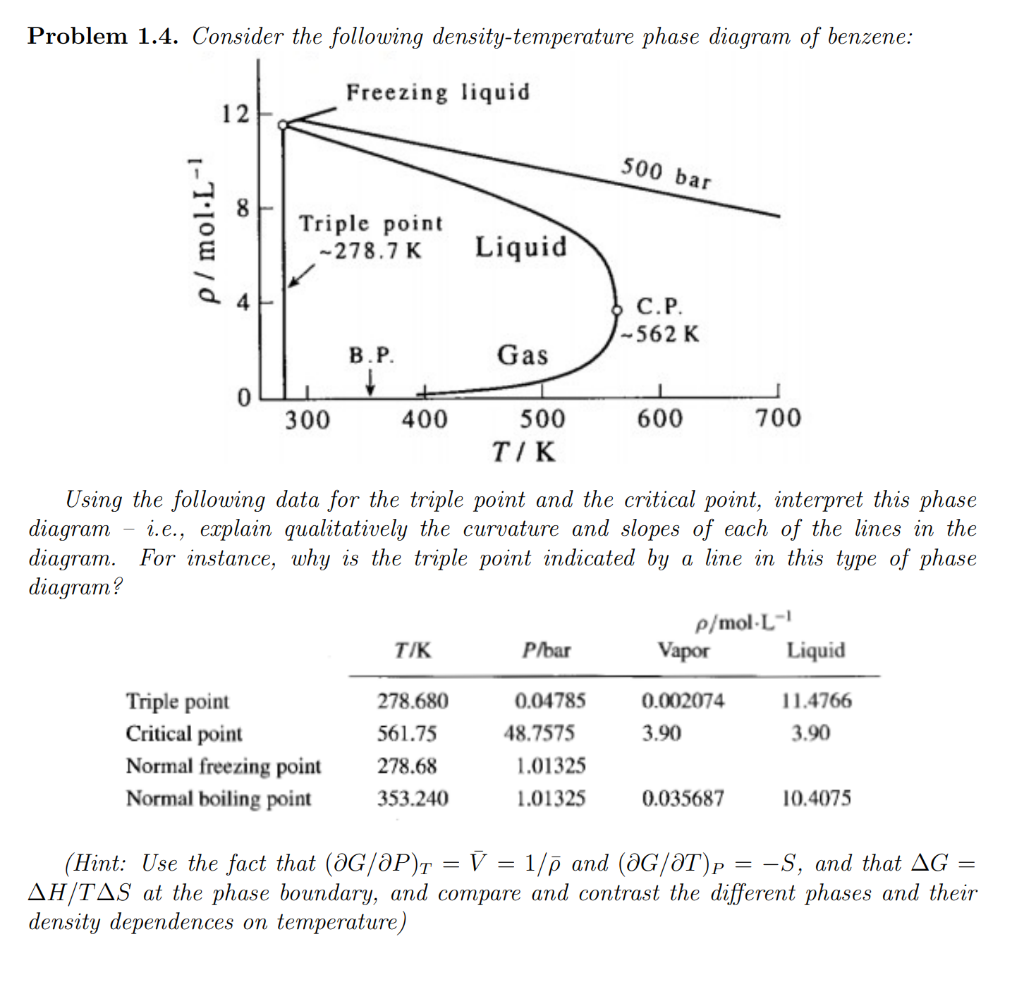
Problem 1.4. Consider the following density-temperature phase diagram of benzene: Using the following data for the triple point and the critical point, interpret this phase diagram - i.e., explain qualitatively the curvature and slopes of each of the lines in the diagram. For instance, why is the triple point indicated by a line in this type of phase diagram? (Hint: Use the fact that \( (\partial G / \partial P)_{T}=\bar{V}=1 / \bar{\rho} \) and \( (\partial G / \partial T)_{P}=-S \), and that \( \Delta G= \) \( \Delta H / T \Delta S \) at the phase boundary, and compare and contrast the different phases and their density dependences on temperature)