Home /
Expert Answers /
Economics /
please-solve-the-graph-below-depicts-the-revenue-and-cost-curves-for-a-firm-operating-in-the-athleti-pa238
(Solved): please solve The graph below depicts the revenue and cost curves for a firm operating in the athleti ...
please solve
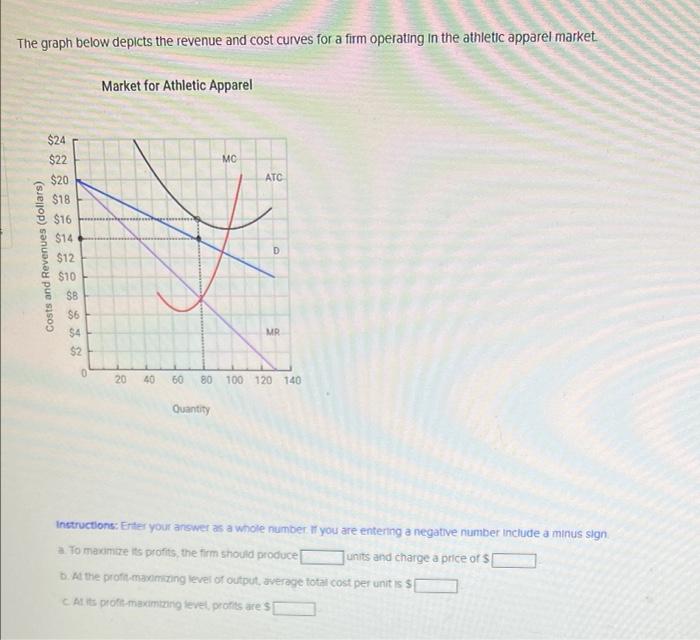
The graph below depicts the revenue and cost curves for a firm operating in the athletic apparel market. Costs and Revenues (dollars) $24 $22 $20 $18 $16 $14 $12 $10 $B $6 $4 $2 0 Market for Athletic Apparel 20 40 60 MC Quantity ATC D MR 80 100 120 140 Instructions: Enter your answer as a whole number. If you are entering a negative number include a minus sign a. To maximize its profits, the firm should produce units and charge a price of $ b. At the profit-maximizing level of output, average total cost per unit is $[ c At its profit-maximizing level, profits are $
Expert Answer
Answer:- Given that: From the given information, (A) To maximize its profits, the firm should produce Profit is maximized when MR=MC i.e. at the output where MR and MC curves intersect. MR and