Home /
Expert Answers /
Economics /
please-plot-points-on-graph-the-graph-shows-the-market-for-boltled-water-draw-a-point-at-the-equlli-pa867
(Solved): please plot points on graph The graph shows the market for boltled water. Draw a point at the equlli ...
please plot points on graph
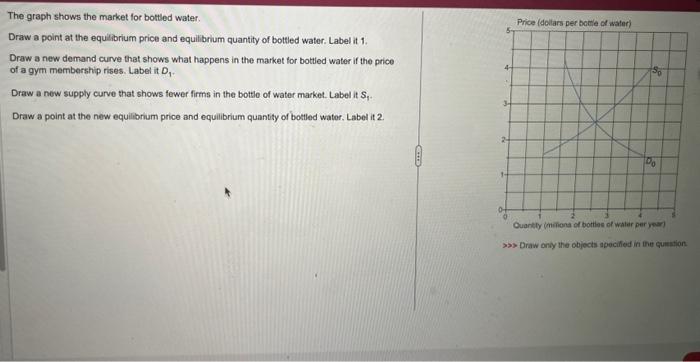
The graph shows the market for boltled water. Draw a point at the equllibrium price and equilibrium quantity of bottled water. Label it 1 . Draw a new demand curve that shows what happens in the market for bottled water if the price of a gym membership rises. Label it \( D_{1} \) Draw a new supply curve that shows fewer firms in the bottle of water market. Label it \( S_{1} \). Draw a point at the new equilibrium price and equilibrium quantity of botlled water, Label it 2 . \( >>> \) Draw any the objects apecifed in the ceuentont.
Expert Answer
Equilibrium price and quantity is obtained when the market forces of demand and supply intersect each other. hence here the equilibrium price and quan