Home /
Expert Answers /
Statistics and Probability /
please-help-with-all-parts-the-graph-illustrates-a-normal-distribution-for-the-prices-paid-for-a-par-pa751
(Solved): please help with all parts The graph illustrates a normal distribution for the prices paid for a par ...
please help with all parts
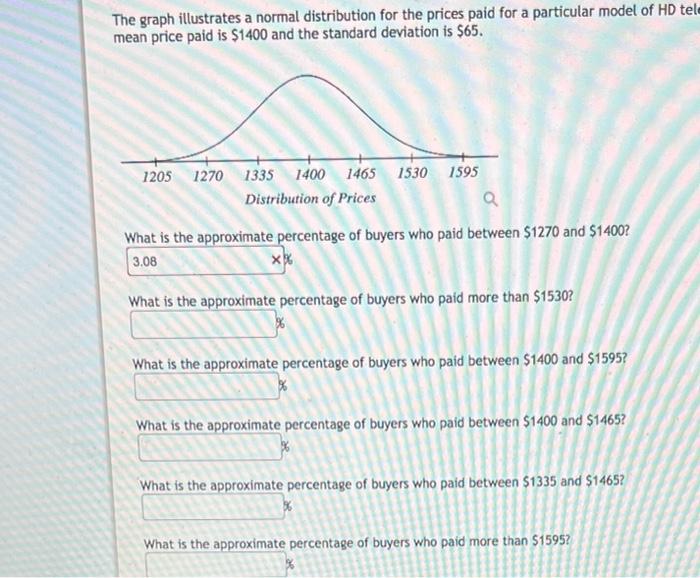
The graph illustrates a normal distribution for the prices paid for a particular model of HD te mean price paid is \( \$ 1400 \) and the standard deviation is \( \$ 65 \). What is the approximate percentage of buyers who paid between \( \$ 1270 \) and \( \$ 1400 \) ? b What is the approximate percentage of buyers who paid more than \( \$ 1530 \) ? * What is the approximate percentage of buyers who paid between \( \$ 1400 \) and \( \$ 1595 ? \) is What is the approximate percentage of buyers who paid between \( \$ 1400 \) and \( \$ 1465 ? \) What is the approximate percentage of buyers who paid between \( \$ 1335 \) and \( \$ 1465 \) ? \( k \) What is the approximate percentage of buyers who paid more than \( \$ 1595 \) ?
Expert Answer
Given, Mean, ?=1,400 Standard deviation, ?=65 Let X be the price paid for a particular model of HD TV a) The approximate percentage of buyers who paid