Home /
Expert Answers /
Statistics and Probability /
please-help-construct-a-scatter-diagram-using-the-data-table-to-the-right-this-data-is-from-a-study-pa935
(Solved): please help Construct a scatter diagram using the data table to the right. This data is from a study ...
please help
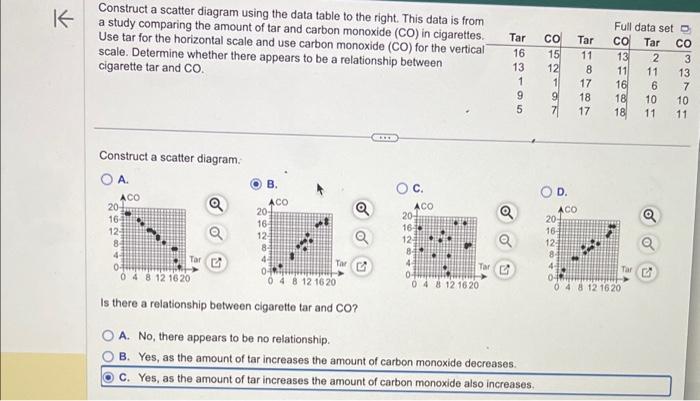
Construct a scatter diagram using the data table to the right. This data is from a study comparing the amount of tar and carbon monoxide \( (\mathrm{CO}) \) in cigarettes. Use tar for the horizontal scale and use carbon monoxide (CO) for the vertical scale. Determine whether there appears to be a relationship between cigarette tar and CO. Construct a scatter diagram. A. B. C. Is there a relationship between cigarette tar and CO? A. No, there appears to be no relationship. B. Yes, as the amount of tar increases the amount of carbon monoxide decreases. C. Yes, as the amount of tar increases the amount of carbon monoxide also increases.
Expert Answer
Solution: We have to construct a scatter diagram using the data table given in question This data is from a study comparing the am