Home /
Expert Answers /
Economics /
please-graph-clearly-show-me-each-point-and-its-plots-nbsp-suppose-there-is-some-hypothetical-ec-pa177
(Solved): PLEASE GRAPH CLEARLY. SHOW ME EACH POINT AND ITS PLOTS. Suppose there is some hypothetical ec ...
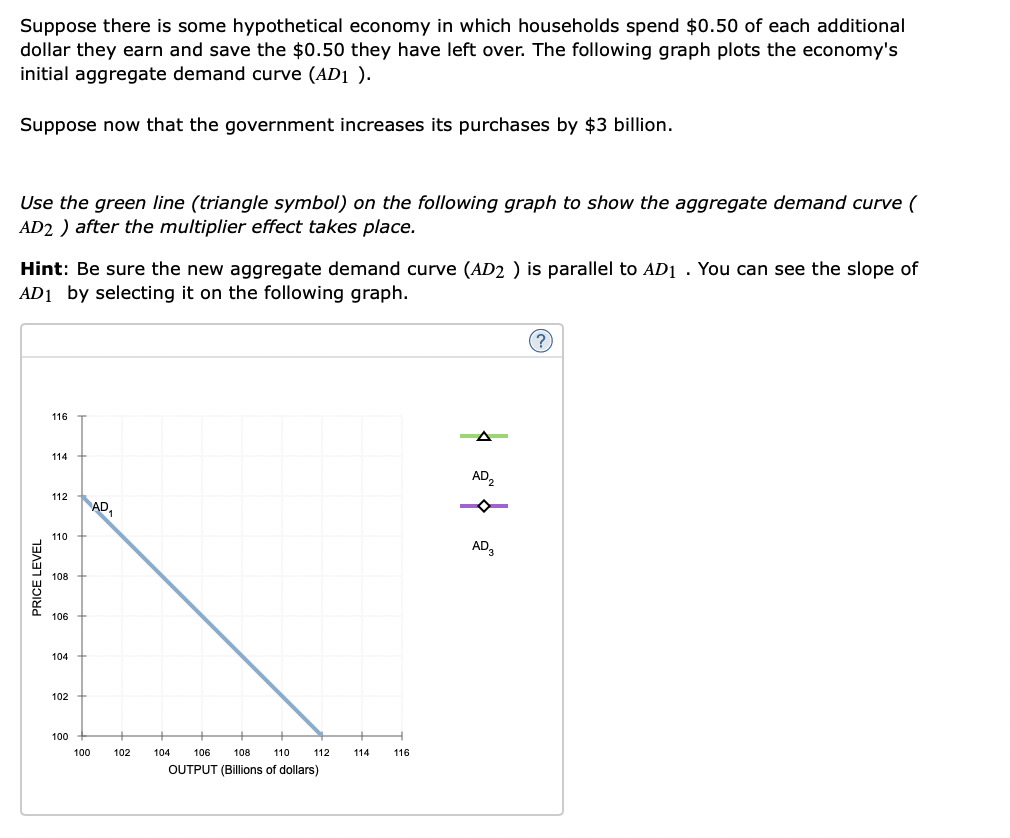
Suppose there is some hypothetical economy in which households spend \( \$ 0.50 \) of each additional dollar they earn and save the \( \$ 0.50 \) they have left over. The following graph plots the economy's initial aggregate demand curve \( \left(A D_{1}\right) \). Suppose now that the government increases its purchases by \( \$ 3 \) billion. Use the green line (triangle symbol) on the following graph to show the aggregate demand curve ( \( A D_{2} \) ) after the multiplier effect takes place. Hint: Be sure the new aggregate demand curve \( \left(A D_{2}\right) \) is parallel to \( A D_{1} \). You can see the slope of \( A D_{1} \) by selecting it on the following graph.
Expert Answer
Step-1 Given, MPC=0.5 MPS=0.5 When goverment spending rises by $3 b