Home /
Expert Answers /
Statistics and Probability /
part-i-the-following-scatterplot-shows-the-relationship-between-high-school-gpa-and-university-gpa-pa733
(Solved): Part I. The following scatterplot shows the relationship between High School GPA and University GPA ...
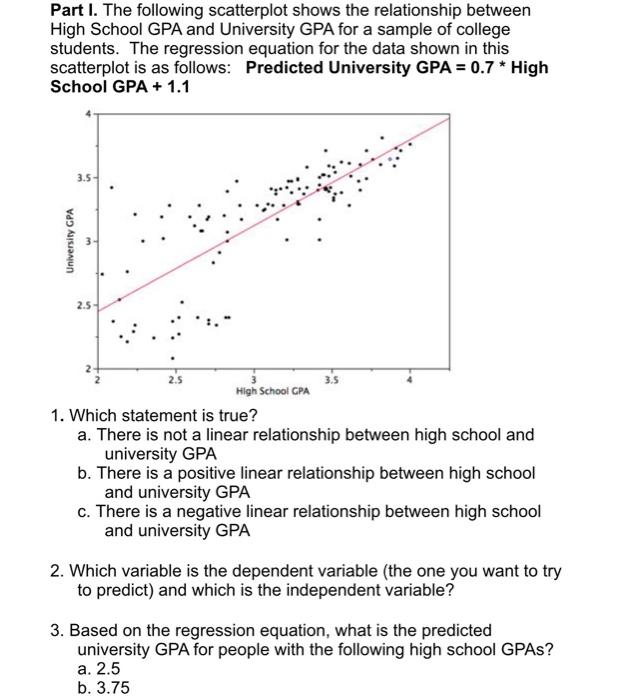
Part I. The following scatterplot shows the relationship between High School GPA and University GPA for a sample of college students. The regression equation for the data shown in this scatterplot is as follows: Predicted University GPA = 0.7 * High School GPA + 1.1 3.5- 2.5 2.5 3.5 High School GPA 1. Which statement is true? a. There is not a linear relationship between high school and university GPA b. There is a positive linear relationship between high school and university GPA c. There is a negative linear relationship between high school and university GPA 2. Which variable is the dependent variable (the one you want to try to predict) and which is the independent variable? 3. Based on the regression equation, what is the predicted university GPA for people with the following high school GPAS? a. 2.5 b. 3.75 University GPA
Expert Answer
1) The scatter diagram shows there is a linear relationship and the regression line moves upwards when high s