Home /
Expert Answers /
Electrical Engineering /
part-1-awgn-channel-conditions-use-matlab-to-simulate-the-ber-versus-signal-to-noise-ratio-snr-pa894
(Solved): Part 1. AWGN Channel Conditions Use MATLAB to simulate the BER versus signal-to-noise ratio (SNR) ...
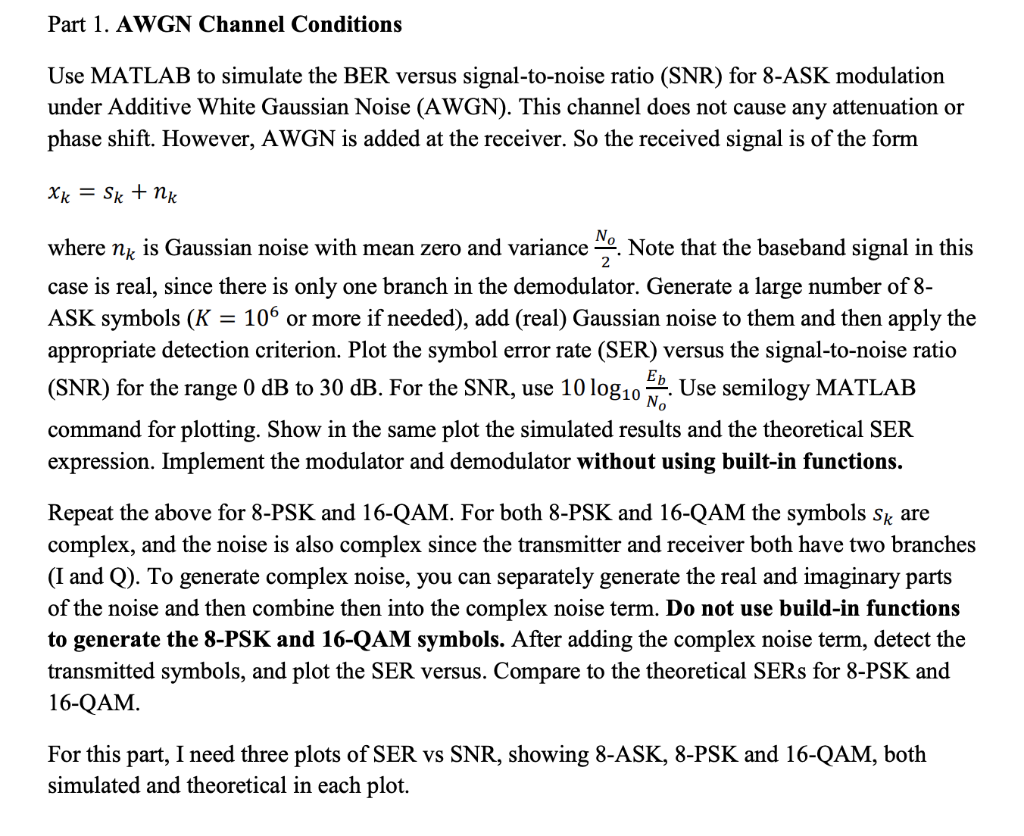
Part 1. AWGN Channel Conditions Use MATLAB to simulate the BER versus signal-to-noise ratio (SNR) for 8-ASK modulation under Additive White Gaussian Noise (AWGN). This channel does not cause any attenuation or phase shift. However, AWGN is added at the receiver. So the received signal is of the form \( x_{k}=s_{k}+n_{k} \) where \( n_{k} \) is Gaussian noise with mean zero and variance \( \frac{N_{o}}{2} \). Note that the baseband signal in this case is real, since there is only one branch in the demodulator. Generate a large number of 8 ASK symbols \( \left(K=10^{6}\right. \) or more if needed), add (real) Gaussian noise to them and then apply the appropriate detection criterion. Plot the symbol error rate (SER) versus the signal-to-noise ratio (SNR) for the range \( 0 \mathrm{~dB} \) to \( 30 \mathrm{~dB} \). For the SNR, use \( 10 \log _{10} \frac{E_{b}}{N_{o}} \). Use semilogy MATLAB command for plotting. Show in the same plot the simulated results and the theoretical SER expression. Implement the modulator and demodulator without using built-in functions. Repeat the above for 8-PSK and 16-QAM. For both 8-PSK and 16-QAM the symbols \( s_{k} \) are complex, and the noise is also complex since the transmitter and receiver both have two branches (I and Q). To generate complex noise, you can separately generate the real and imaginary parts of the noise and then combine then into the complex noise term. Do not use build-in functions to generate the 8-PSK and 16-QAM symbols. After adding the complex noise term, detect the transmitted symbols, and plot the SER versus. Compare to the theoretical SERs for 8-PSK and 16-QAM. For this part, I need three plots of SER vs SNR, showing 8-ASK, 8-PSK and 16-QAM, both simulated and theoretical in each plot.
Expert Answer
Please refer below steps matlab code %%% matlab code of bpsk clc; clear all; N=10^6; x=randi([0 1],1,10^6); %Random numbers m=2*x-1; %Modulated signal