Home /
Expert Answers /
Economics /
on-the-following-graph-use-the-green-point-triangle-symbol-to-plot-the-annual-total-revencie-w-pa199
(Solved): On the following graph, use the green point (triangle symbol) to plot the annual total revencie w ...
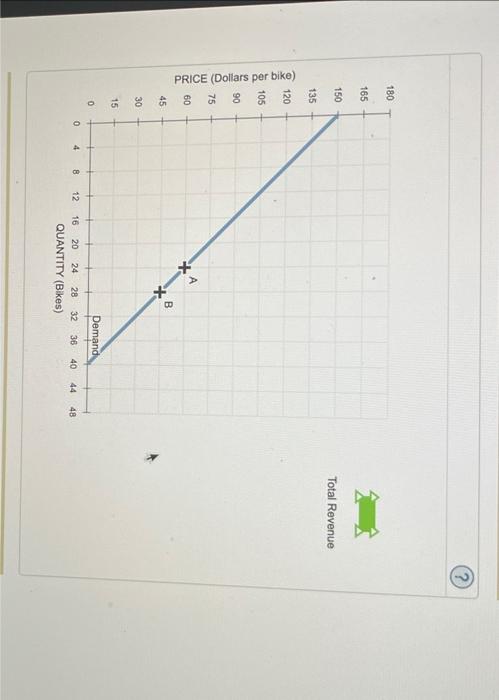
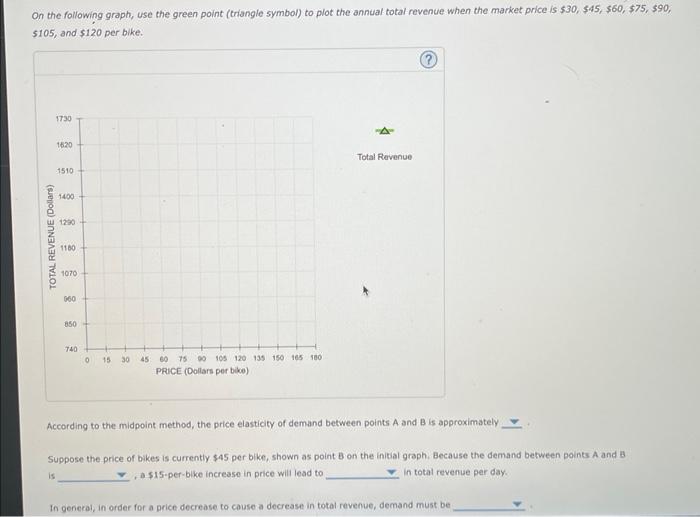
On the following graph, use the green point (triangle symbol) to plot the annual total revencie when the market price is \( \$ 30 \), \( \$ 45 \), \( \$ 60 \), \( \$ 75 \), \( \$ 90 \), \( \$ 105 \), and \( \$ 120 \) per bike. According to the midpoint method, the price elasticity of demand between points \( A \) and \( B \) is approximately Suppose the price of bikes is currently \( \$ 45 \) per blke, shown as point B on the inital graph. Because the demand between points \( A \) and a is , a \( \$ 15 \)-per-blke increase in price will lead to in total revense per day. In general, in order for a price decrease to cause a decrease in total revenue, demand must be
Expert Answer
ANSWER :- QUANTITY PRICE TR(PRICE * QUANTITY) $30 32 ($30*32) = $960 $45 28 ($45*28) = $1260 $60 24 ($60*24) = $1440 $75 20 ($75*20) = $1500 $90 16 ($90*16) = $1440 $105 12 ($105*12) = $1260 $120 8 ($120*8) = $960 elasticity of demand :- = Change in