Home /
Expert Answers /
Economics /
on-the-following-graph-use-the-blue-points-circle-symbol-to-plot-blewitt-39-s-labor-demand-curve-pa365
(Solved): On the following graph, use the blue points (circle symbol) to plot Blewitt's labor demand curve ...
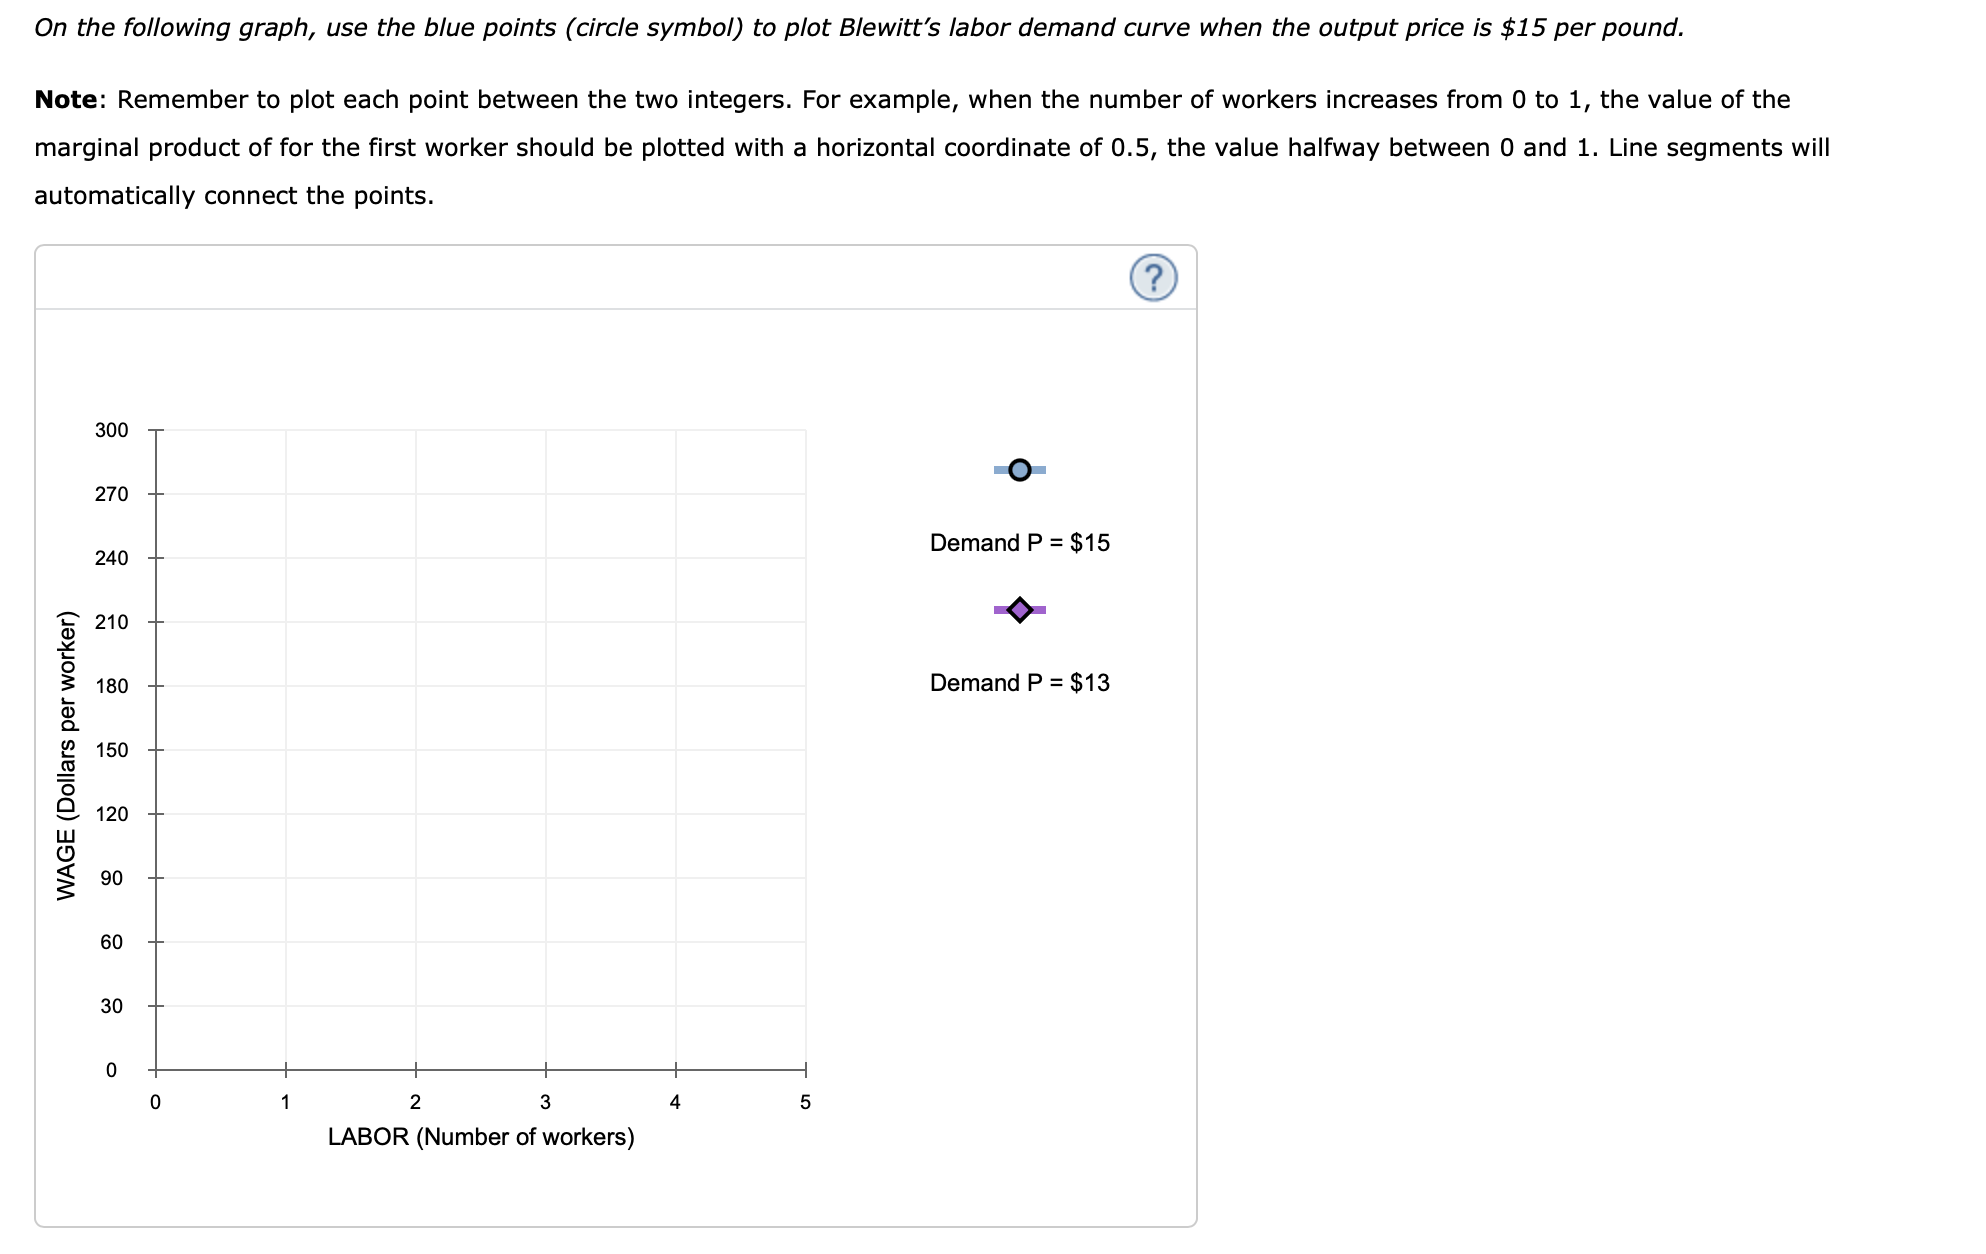
On the following graph, use the blue points (circle symbol) to plot Blewitt's labor demand curve when the output price is per pound. Note: Remember to plot each point between the two integers. For example, when the number of workers increases from 0 to 1 , the value of the marginal product of for the first worker should be plotted with a horizontal coordinate of 0.5 , the value halfway between 0 and 1 . Line segments will automatically connect the points.
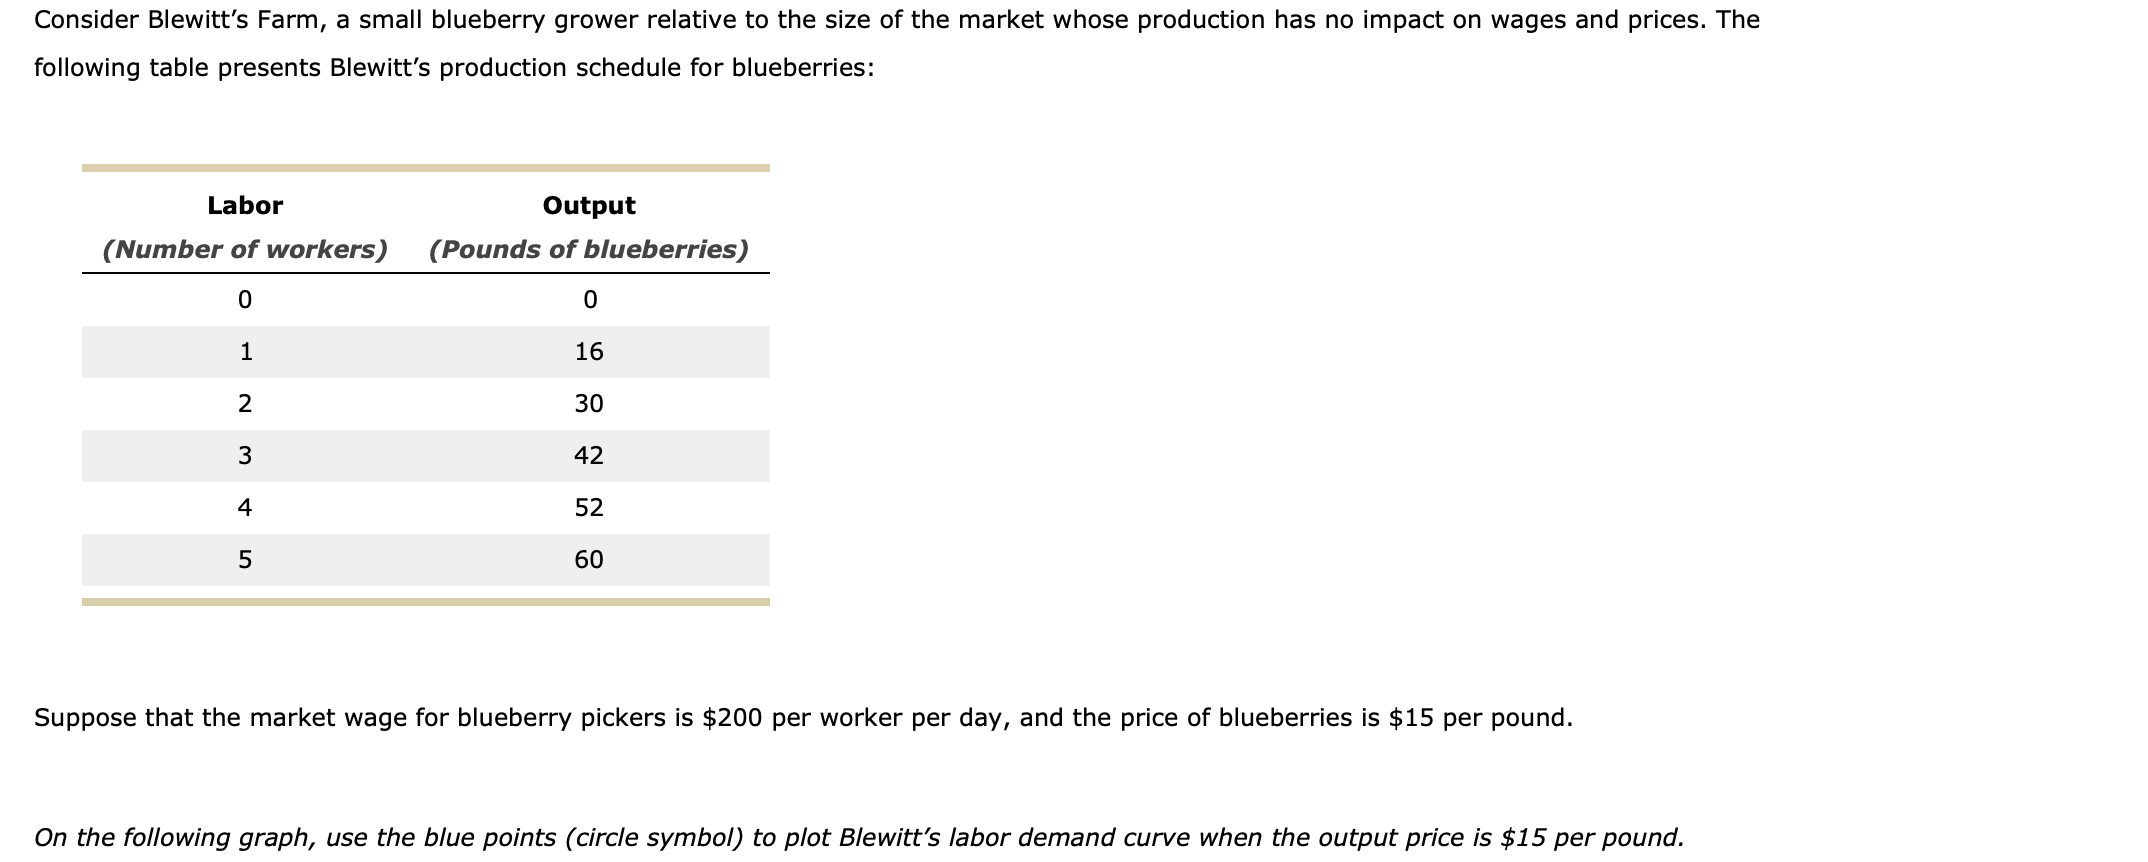
Consider Blewitt's Farm, a small blueberry grower relative to the size of the market whose production has no impact on wages and prices. The following table presents Blewitt's production schedule for blueberries: Suppose that the market wage for blueberry pickers is per worker per day, and the price of blueberries is per pound. On the following graph, use the blue points (circle symbol) to plot Blewitt's labor demand curve when the output price is per pound.
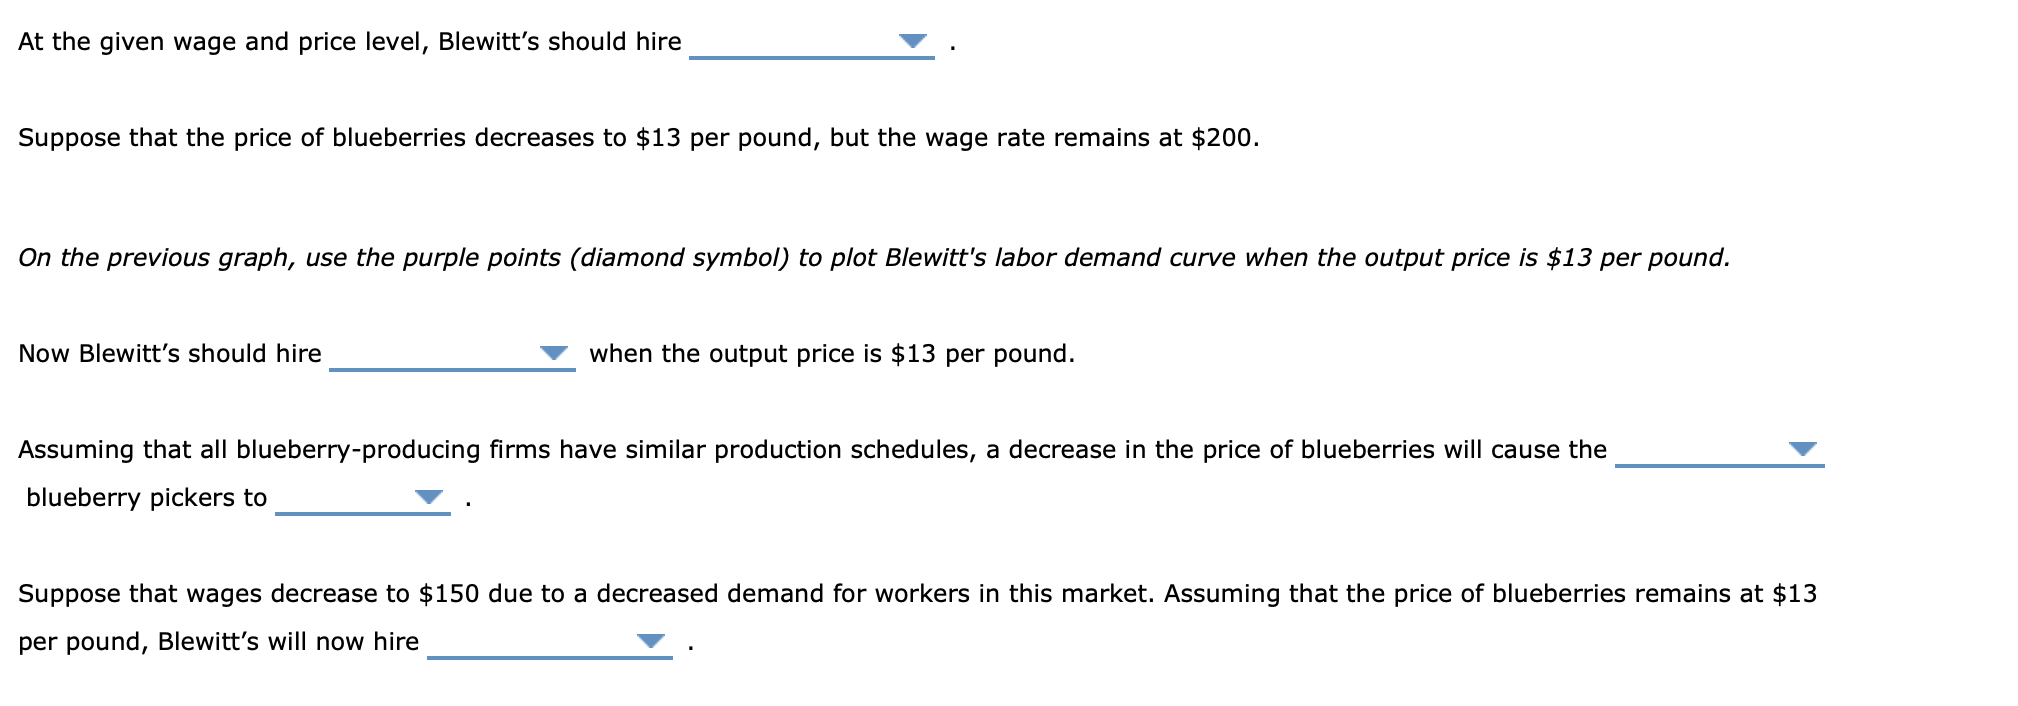
At the given wage and price level, Blewitt's should hire Suppose that the price of blueberries decreases to per pound, but the wage rate remains at . On the previous graph, use the purple points (diamond symbol) to plot Blewitt's labor demand curve when the output price is per pound. Now Blewitt's should hire when the output price is per pound. Assuming that all blueberry-producing firms have similar production schedules, a decrease in the price of blueberries will cause the blueberry pickers to Suppose that wages decrease to due to a decreased demand for workers in this market. Assuming that the price of blueberries remains at per pound, Blewitt's will now hire
Expert Answer
To plot the labor demand curve for Blewitt's Farm at the output pr...