Home /
Expert Answers /
Economics /
need-some-help-with-the-problem-nbsp-the-following-graph-shows-an-aggregate-demand-ad-curve-and-a-pa470
(Solved): need some help with the problem The following graph shows an aggregate demand (AD) curve and a ...
need some help with the problem
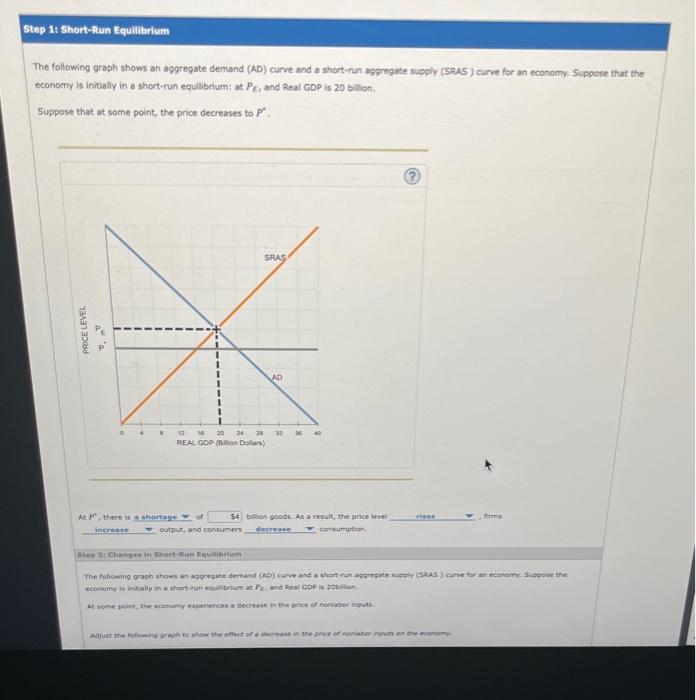
The following graph shows an aggregate demand (AD) curve and a short-run aggregate supply (SRAS) curve for an economp. Suppose that the economy is initially in a short-run equilibrium: at \( P_{\mathcal{C}} \), and Real GDP is 20 billion. Suppose that at some point, the price decreases to \( P^{*} \). (?) Alep 2 i changes in shert-nun Rquisitirium economy is initially in a thart itun equitibeich at Pei and Reel CDp it 20billan. At, seme peirst, the wiohamy exceriences a decrease in the frict of nonidbor inputa.
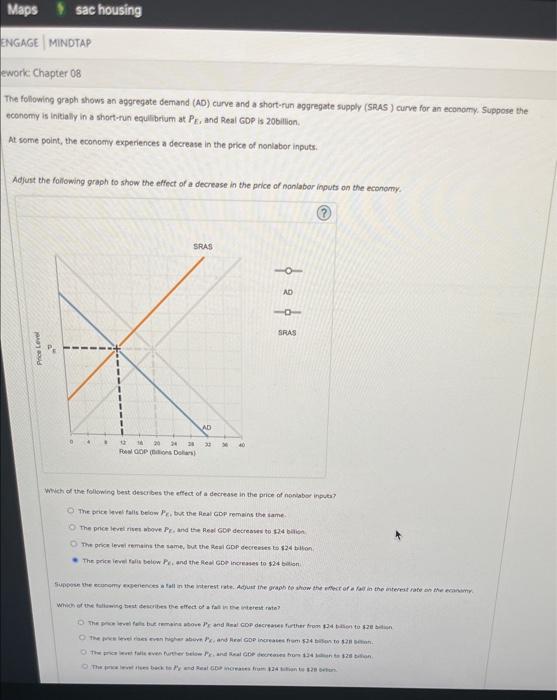
The following graph shows an aggregate dernand (AD) curve and a short-run aggregate supply (SRAS) curve for an economy. Suppose the economy is initially in a short-run equliberium at \( P_{E} \), and Real GDP is zobillion. At some point, the economy experiences a decreate in the price of nonisbor inputs. Adjunt the following graph to show the effect of a decrease in the price of nanlabor inguts on the economy. Which of the following best descibes the efted of a decresse in the price of nonstises inpuer?
Expert Answer
AS-AD The AD-AS model helps to explain how national income is determined and how the price level evolves. This may be used to demonstrate the many sta