Home /
Expert Answers /
Electrical Engineering /
need-help-procedure-1-measure-the-resistance-of-r1-the-color-code-value-is-2-7k-r1-2-con-pa779
(Solved): need help PROCEDURE 1. Measure the resistance of R1. The color-code value is 2.7k.R1= 2. Con ...
need help
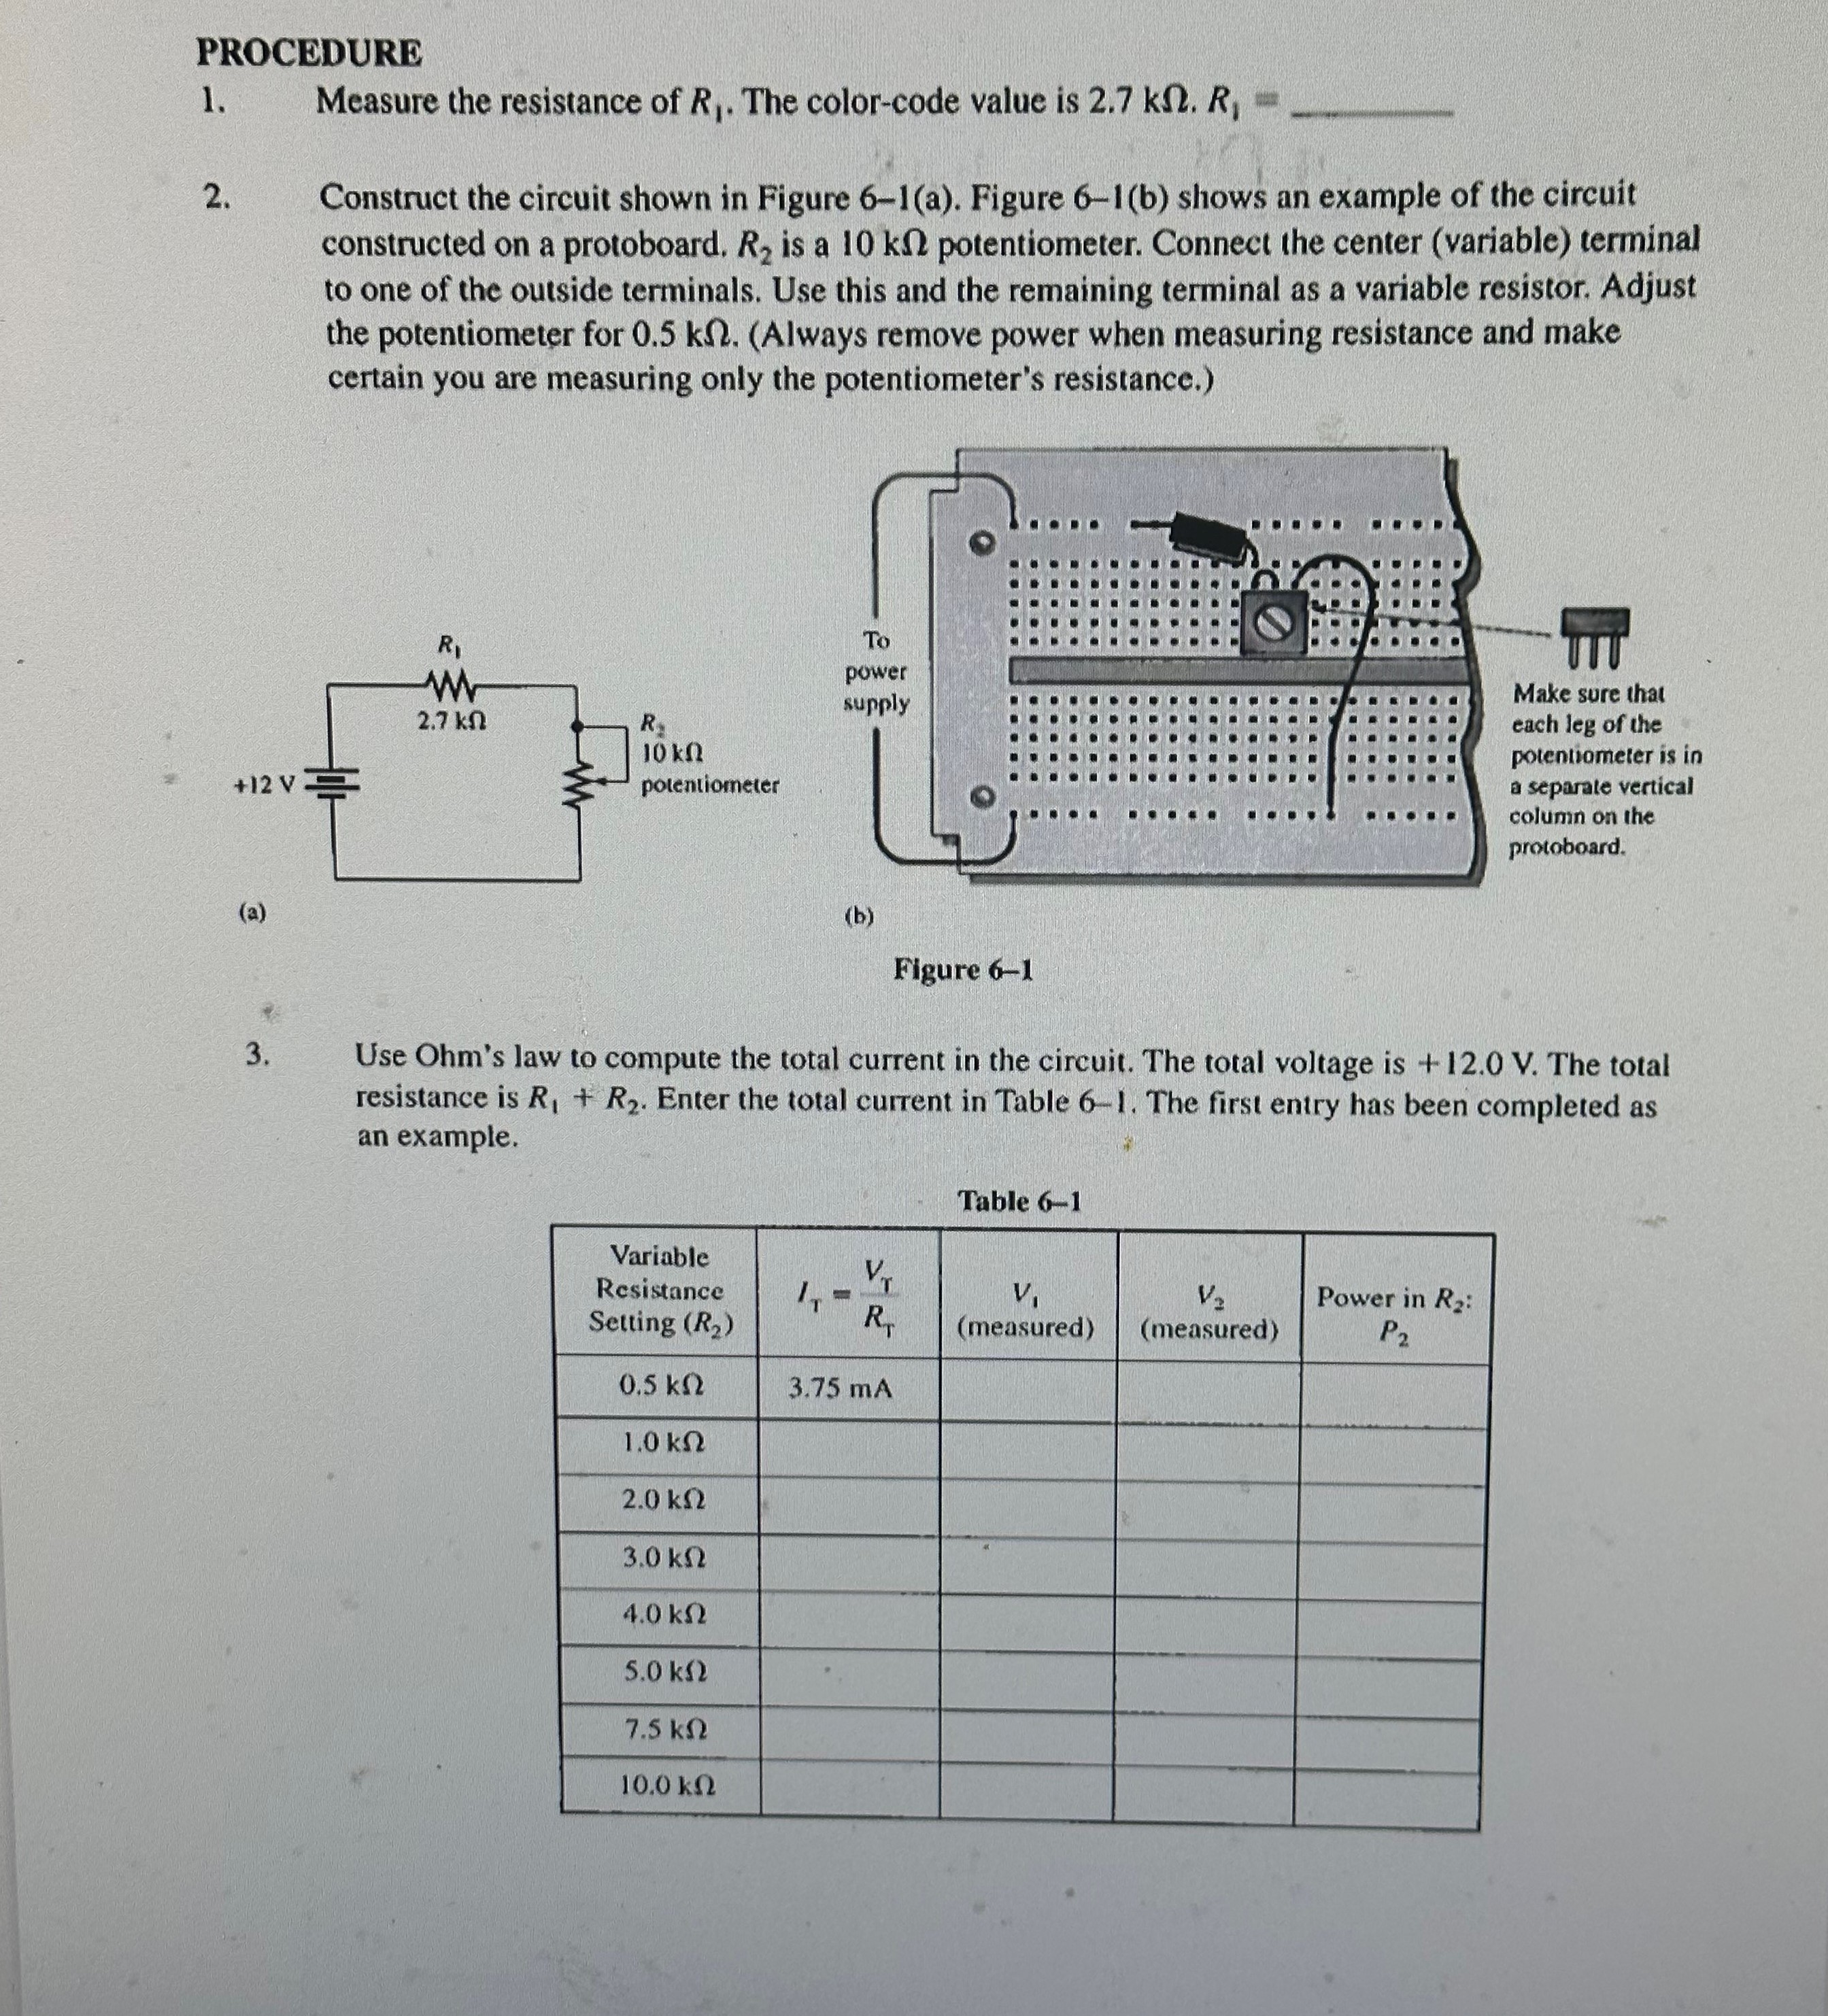
PROCEDURE 1. Measure the resistance of . The color-code value is 2. Construct the circuit shown in Figure 6-1(a). Figure 6-1(b) shows an example of the circuit constructed on a protoboard, is a potentiometer. Connect the center (variable) terminal to one of the outside terminals. Use this and the remaining terminal as a variable resistor. Adjust the potentiometer for . (Always remove power when measuring resistance and make certain you are measuring only the potentiometer's resistance.) (a) Figure 6-1 3. Use Ohm's law to compute the total current in the circuit. The total voltage is . The total resistance is . Enter the total current in Table 6-1. The first entry has been completed as an example.
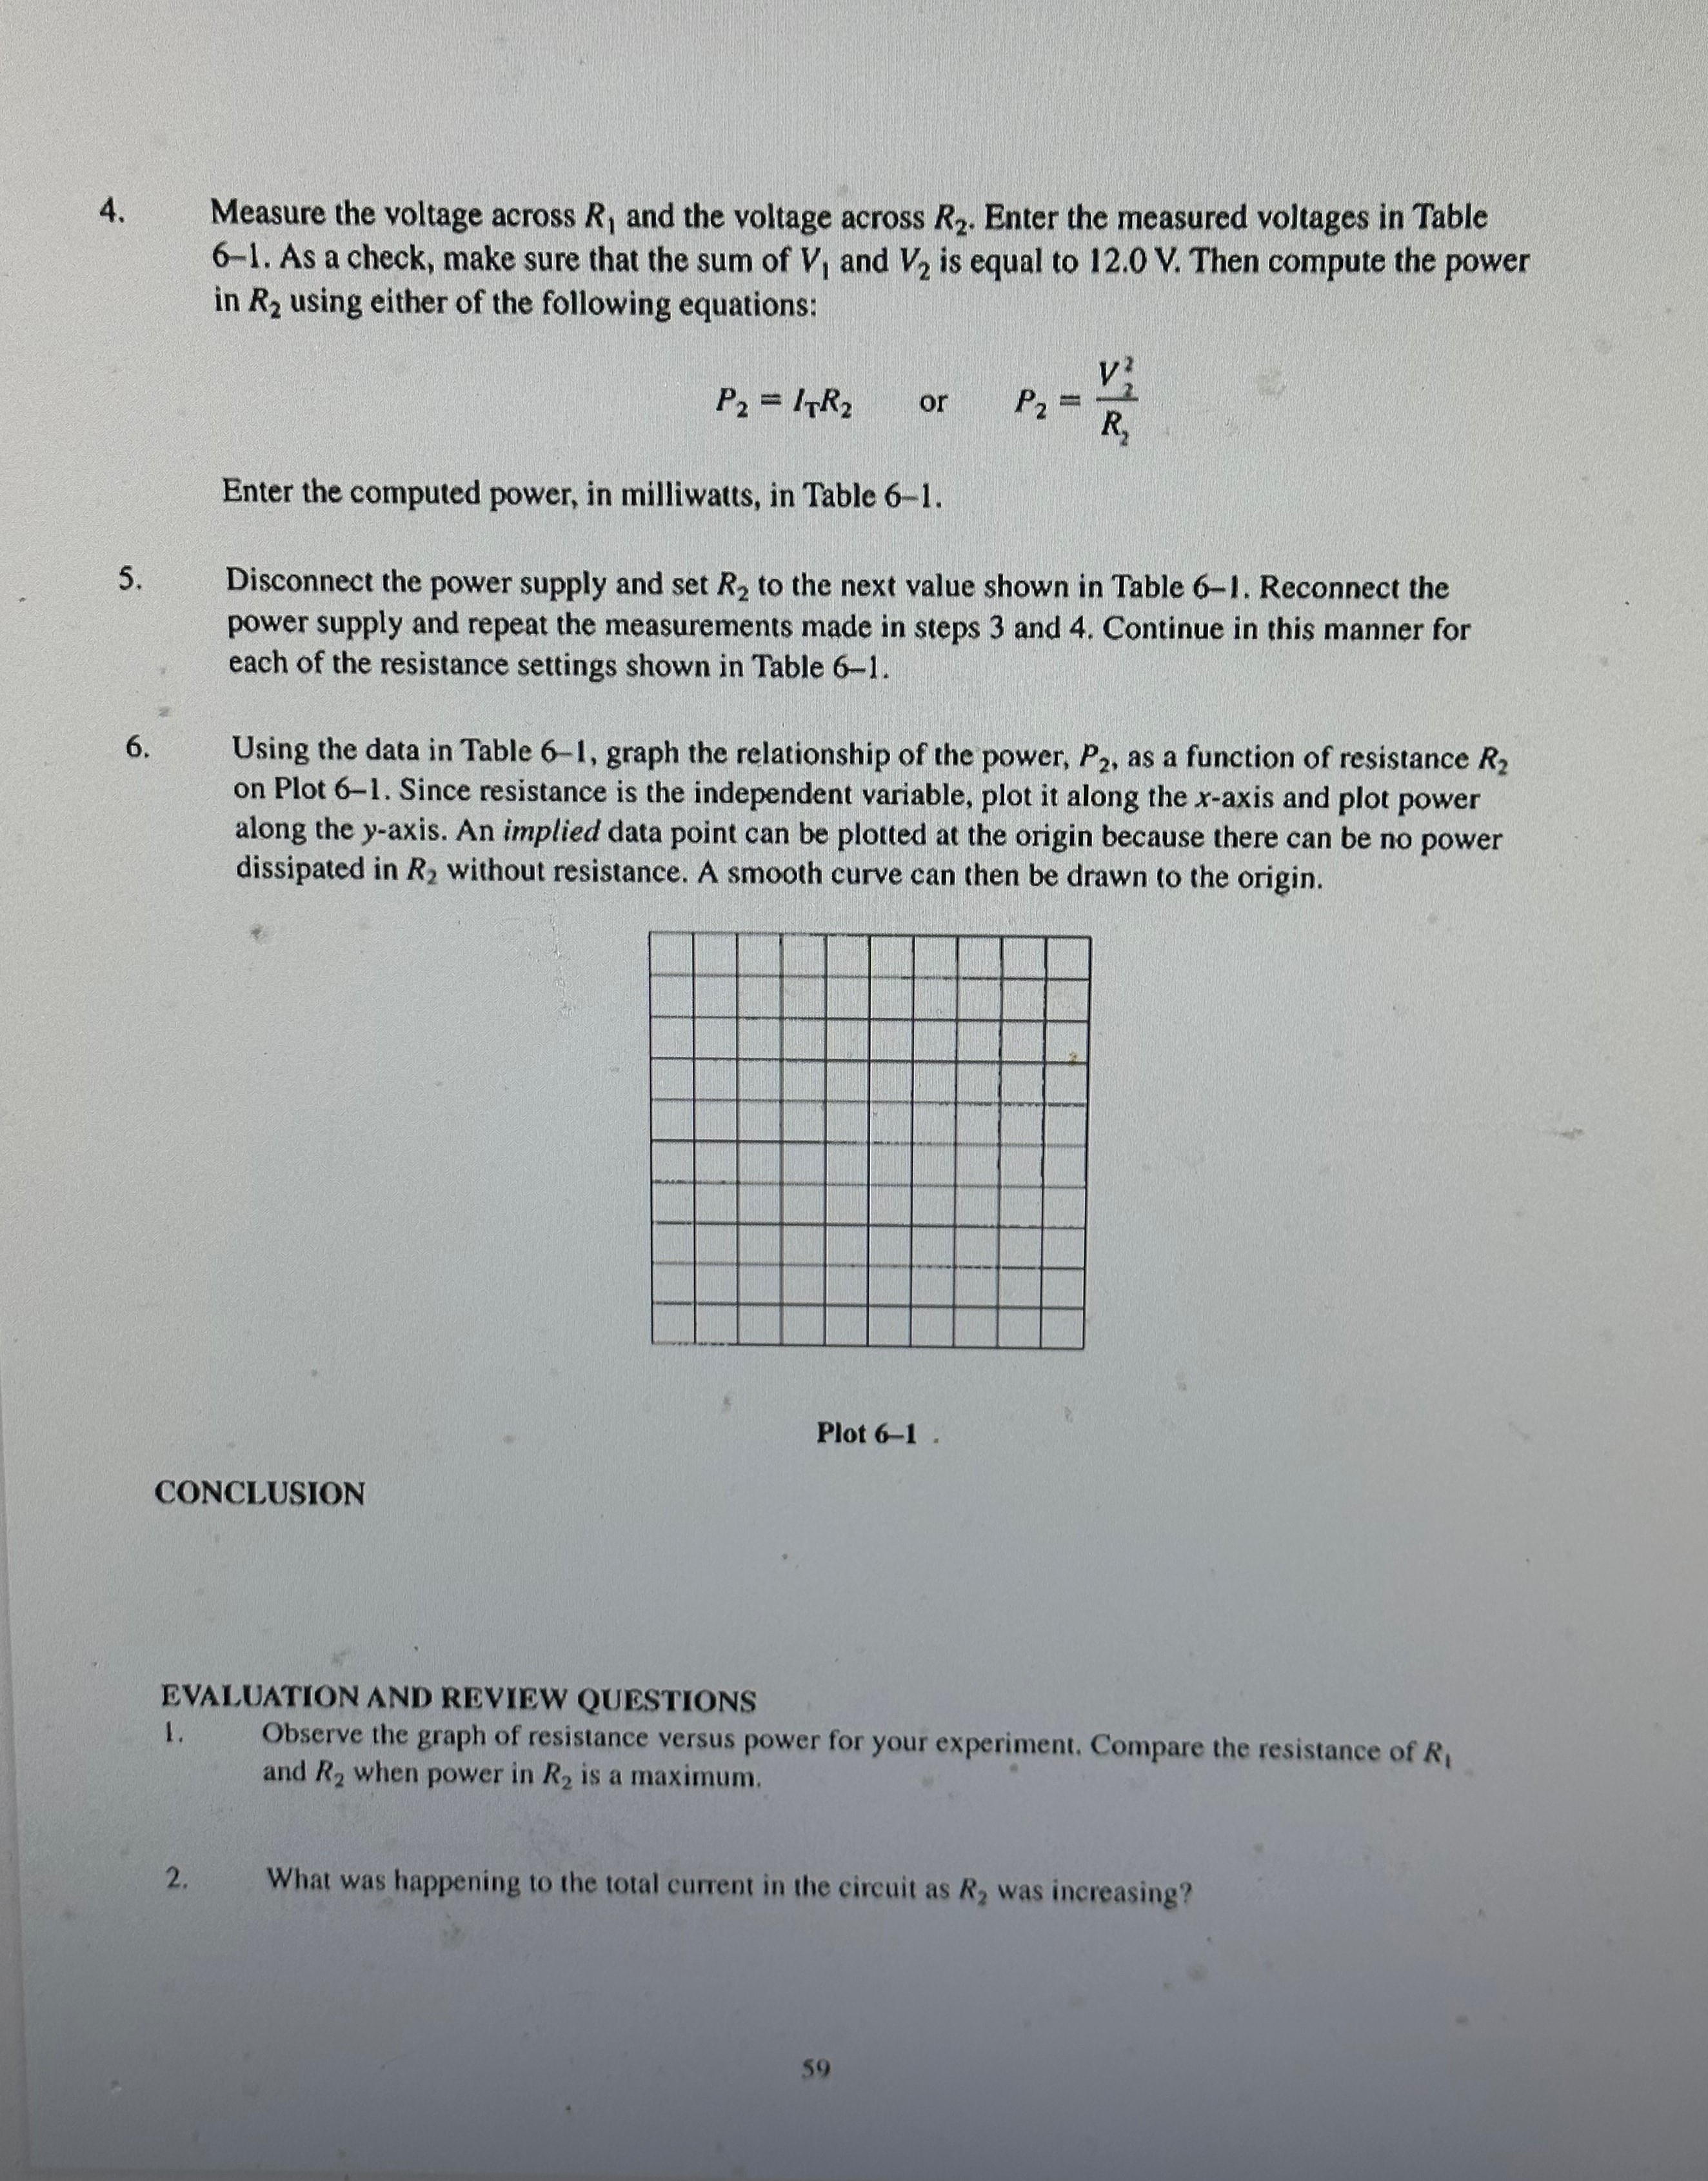
4. Measure the voltage across and the voltage across . Enter the measured voltages in Table 6-1. As a check, make sure that the sum of and is equal to . Then compute the power in using either of the following equations: Enter the computed power, in milliwatts, in Table 6-1. 5. Disconnect the power supply and set to the next value shown in Table 6-1. Reconnect the power supply and repeat the measurements made in steps 3 and 4 . Continue in this manner for each of the resistance settings shown in Table 6-1. 6. Using the data in Table 6-1, graph the relationship of the power, , as a function of resistance on Plot 6-1. Since resistance is the independent variable, plot it along the -axis and plot power along the -axis. An implied data point can be plotted at the origin because there can be no power dissipated in without resistance. A smooth curve can then be drawn to the origin. Plot 6-1 CONCLUSION EVALUATION AND REVIEW QUESTIONS 1. Observe the graph of resistance versus power for your experiment. Compare the resistance of and when power in is a maximum. 2. What was happening to the total current in the circuit as was increasing?