Home /
Expert Answers /
Chemistry /
nbsp-the-graph-below-is-an-arrhenius-plot-which-demonstrates-how-the-rate-constant-of-a-reactio-pa125
(Solved): The graph below is an Arrhenius plot which demonstrates how the rate constant of a reactio ...
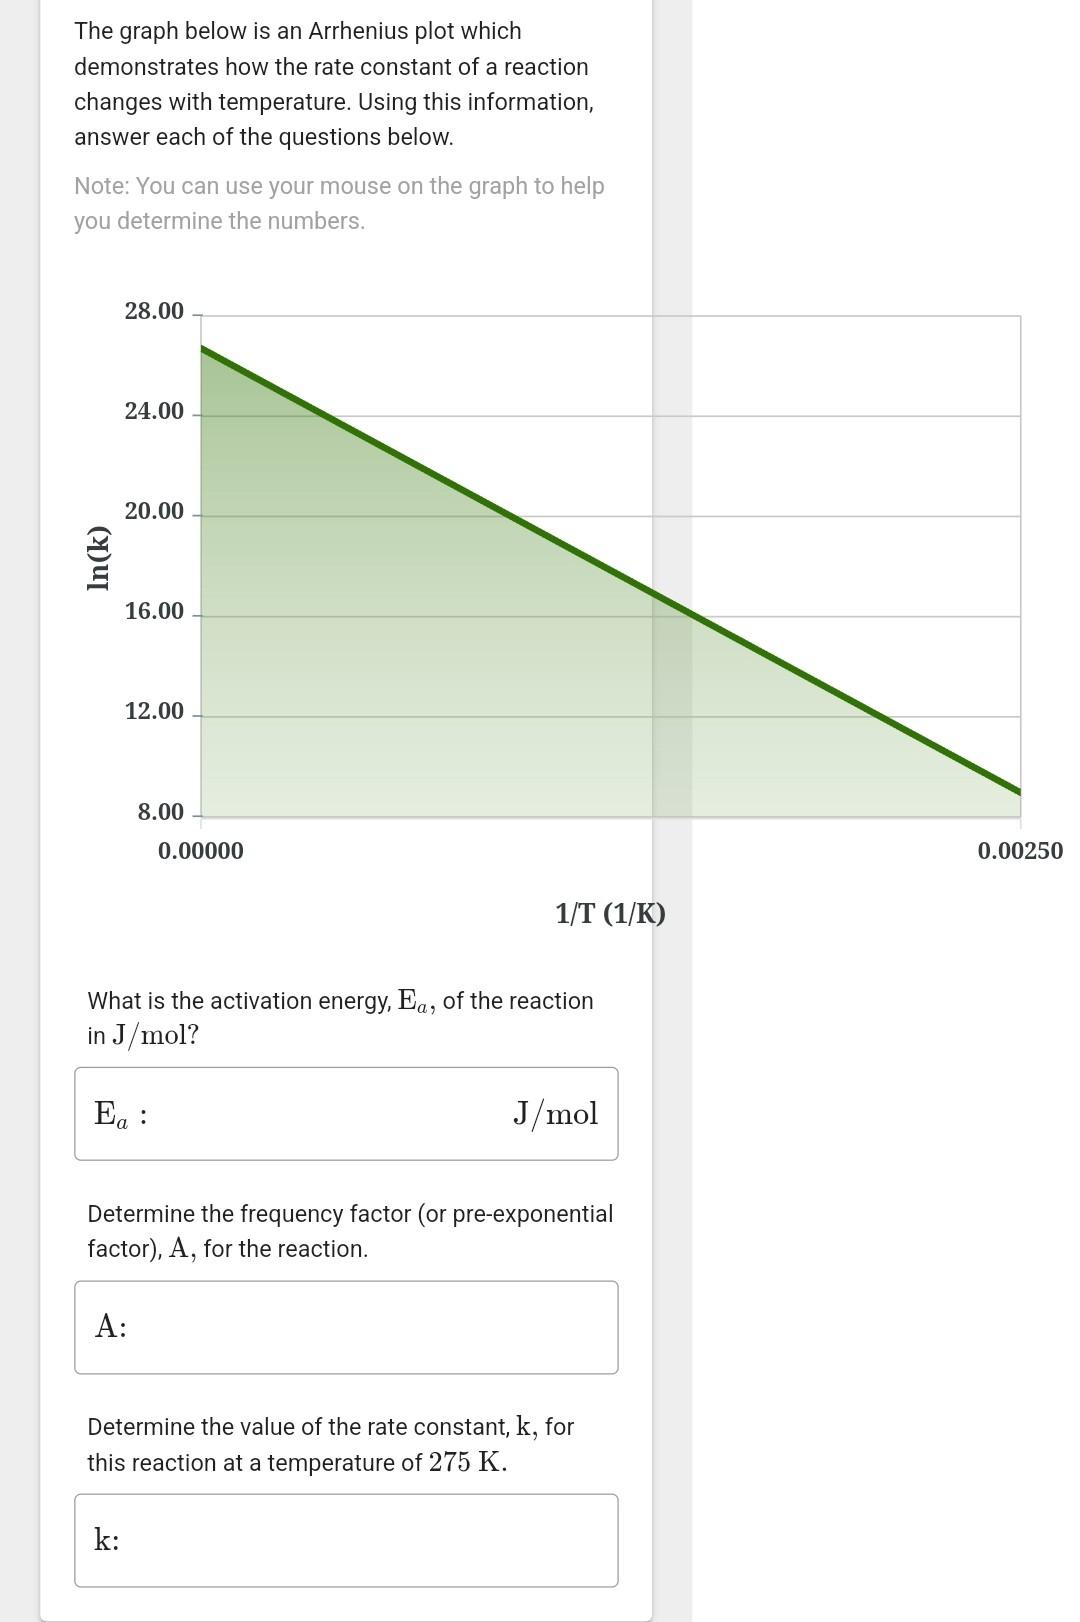
The graph below is an Arrhenius plot which demonstrates how the rate constant of a reaction changes with temperature. Using this information, answer each of the questions below. Note: You can use your mouse on the graph to help you determine the numbers. 28.00 24.00 20.00 In(k) 16.00 12.00 8.00 0.00000 0.00250 1/T (1/K) What is the activation energy, Ea, of the reaction in J/mol? Eq: J/mol Determine the frequency factor (or pre-exponential factor), A, for the reaction. A: Determine the value of the rate constant, k, for this reaction at a temperature of 275 K. k: k