Home /
Expert Answers /
Statistics and Probability /
nbsp-the-following-frequency-graph-shows-the-monthly-spending-of-a-group-of-students-on-their-ce-pa994
(Solved): the following frequency graph shows the monthly spending of a group of students on their ce ...
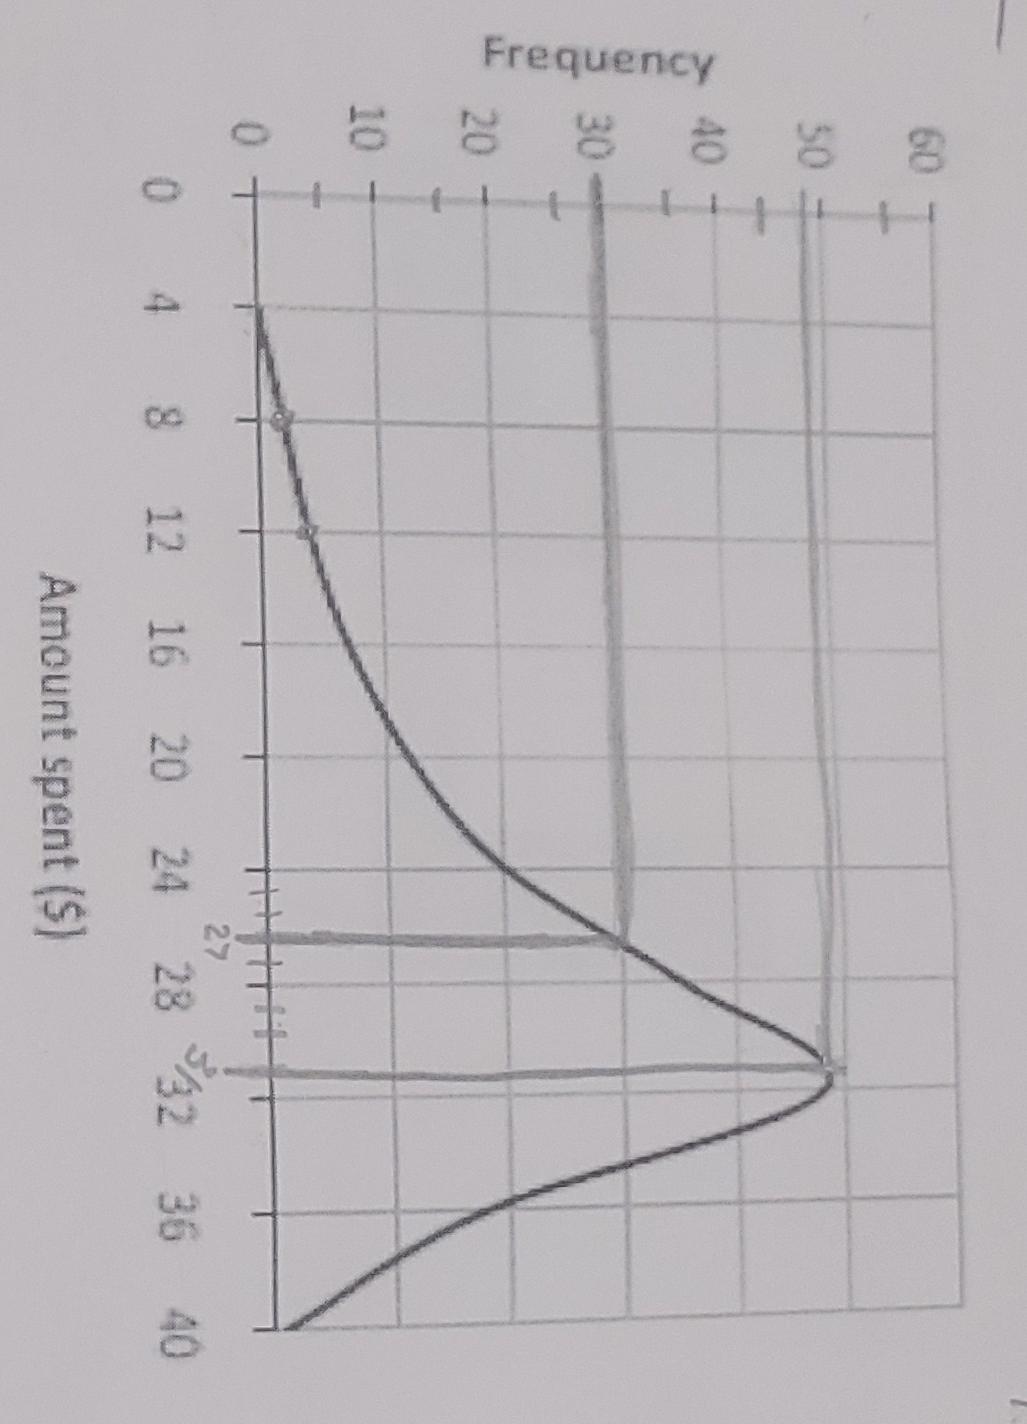
the following frequency graph shows the monthly spending of a group of students on their cell phones. find the mean mode and range. please I just need guidance.
Frequency 60 50 40 30 20 10 0 27 0 4 8 12 16 20 24 28 32 36 40 Amount spent ($)