Home /
Expert Answers /
Economics /
nbsp-nbsp-on-the-following-graph-use-the-blue-line-circle-symbol-to-plot-brian-39-s-product-pa642
(Solved): On the following graph, use the blue line (circle symbol) to plot Brian's product ...
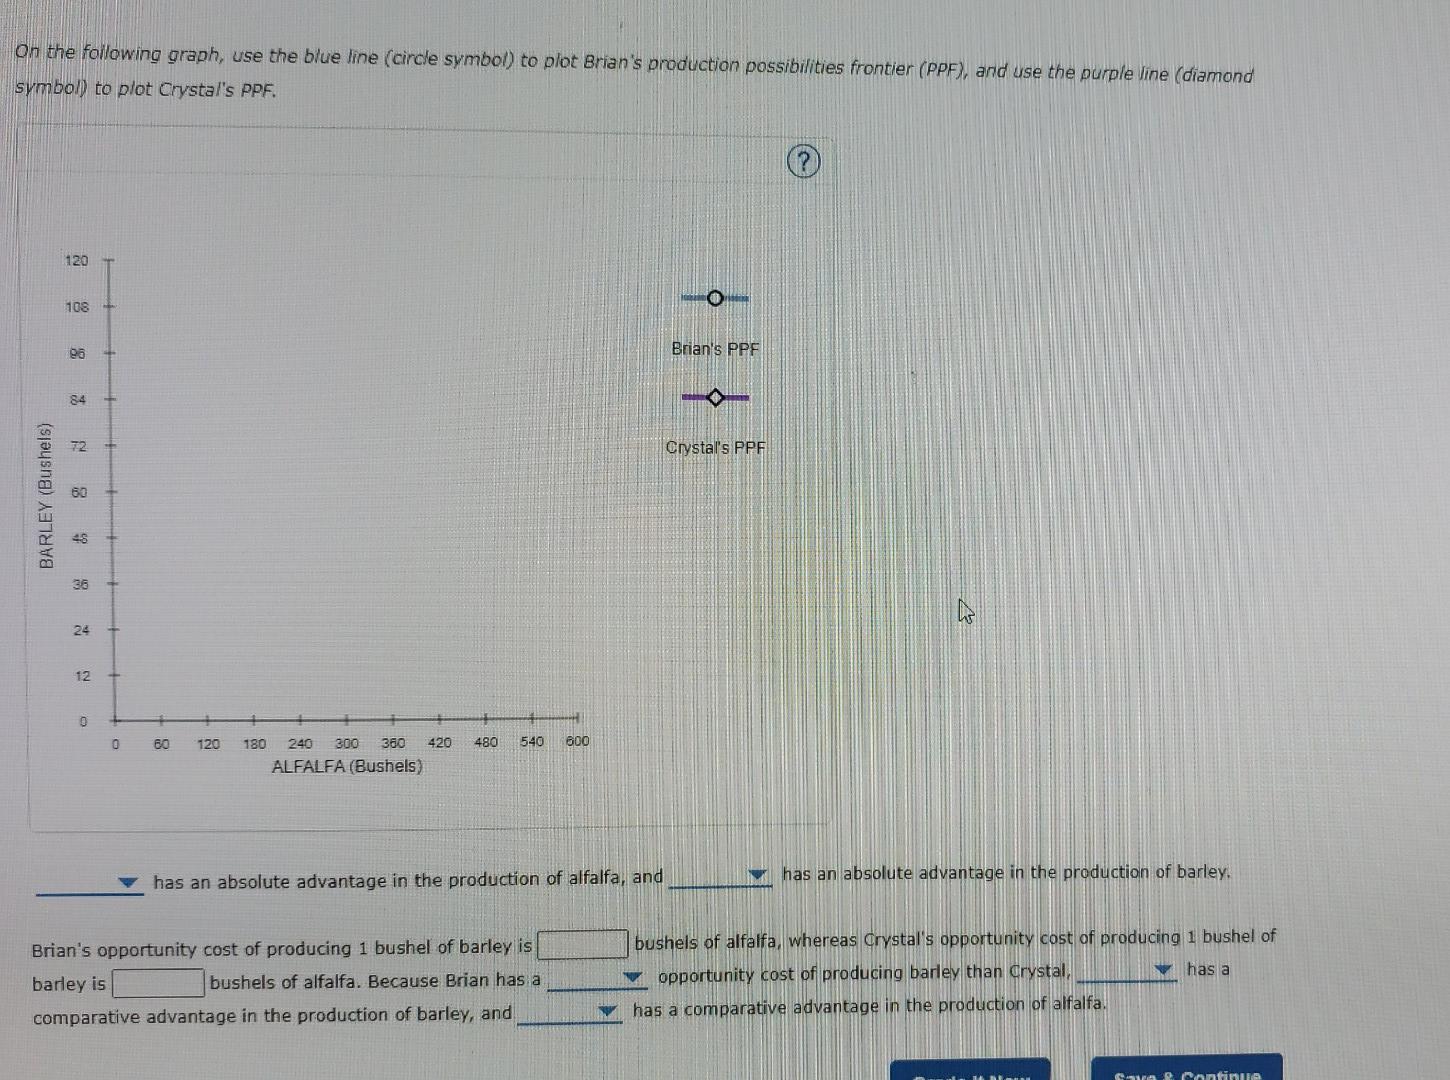
On the following graph, use the blue line (circle symbol) to plot Brian's production possibilities frontier (PPF), and use the purple line (diamond symbol) to plot Crystal's PPF. 120 108 95 84 BARLEY (Bushels) N 8 9 36 24 12 0 0 60 120 180 240 300 360 420 480 540 600 ALFALFA (Bushels) has an absolute advantage in the production of alfalfa, and Brian's opportunity cost of producing 1 bushel of barley is barley is bushels of alfalfa. Because Brian has a comparative advantage in the production of barley, and 111 Brian's PPF Crystal's PPF As has an absolute advantage in the production of barley. bushels of alfalfa, whereas Crystal's opportunity cost of producing 1 bushel of has a opportunity cost of producing barley than Crystal, has a comparative advantage in the production of alfalfa. Save & Continue
On the following graph, use the blue line (circle symbol) to plot Brian's production possibilities frontier (PPF), and use the purple line (diamond symbol) to plot Crystal's PPF. 120 108 95 84 BARLEY (Bushels) N 8 9 36 24 12 0 0 60 120 180 240 300 360 420 480 540 600 ALFALFA (Bushels) has an absolute advantage in the production of alfalfa, and Brian's opportunity cost of producing 1 bushel of barley is barley is bushels of alfalfa. Because Brian has a comparative advantage in the production of barley, and 111 Brian's PPF Crystal's PPF As has an absolute advantage in the production of barley. bushels of alfalfa, whereas Crystal's opportunity cost of producing 1 bushel of has a opportunity cost of producing barley than Crystal, has a comparative advantage in the production of alfalfa. Save & Continue