Home /
Expert Answers /
Chemical Engineering /
nbsp-in-the-two-tank-mixing-process-shown-in-figure-below-x-varies-from-0-lb-salt-ft3-to-1-lb-pa312
(Solved): In the two-tank mixing process shown in Figure below, x varies from 0 lb salt/ft3 to 1 lb ...
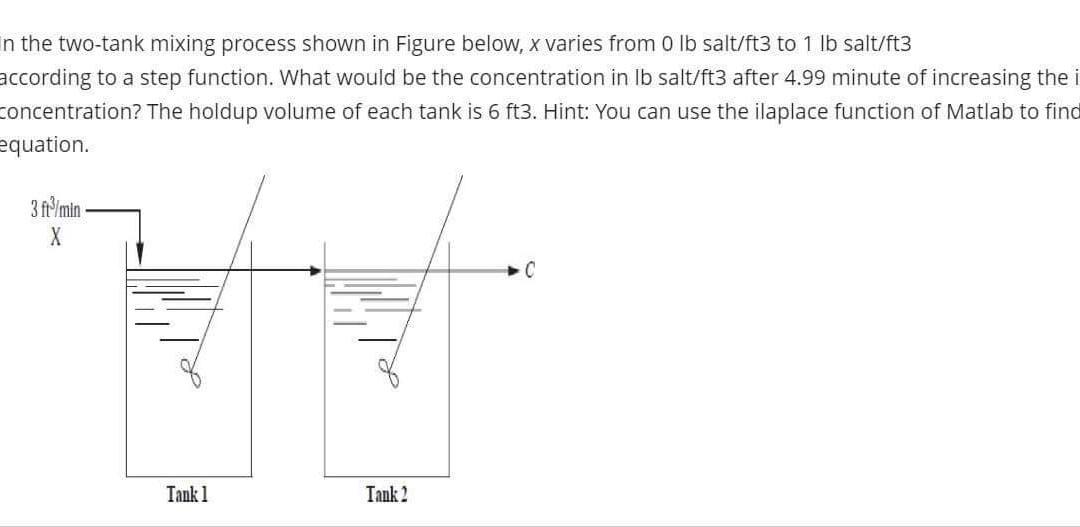
In the two-tank mixing process shown in Figure below, x varies from 0 lb salt/ft3 to 1 lb salt/ft3 according to a step function. What would be the concentration in lb salt/ft3 after 4.99 minute of increasing the i concentration? The holdup volume of each tank is 6 ft3. Hint: You can use the ilaplace function of Matlab to find equation. 3 ft³/min X C Tank 1 Tank 2