Home /
Expert Answers /
Civil Engineering /
nbsp-a-layer-of-soil-profile-in-a-tank-with-downward-seepage-is-shown-in-figure-q2-calculate-t-pa697
(Solved): A layer of soil profile in a tank with downward seepage is shown in Figure Q2. Calculate t ...
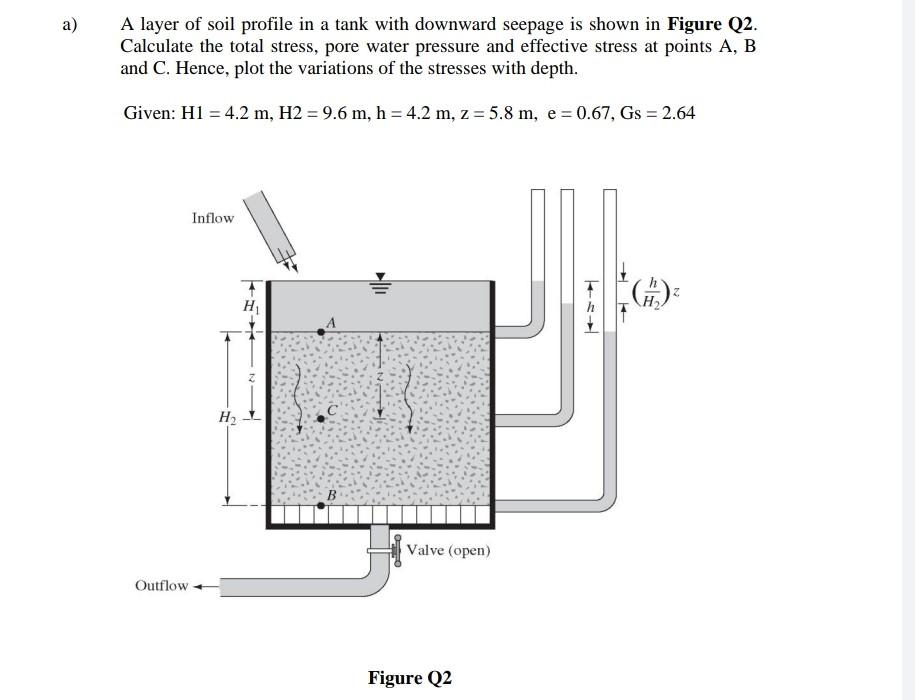
A layer of soil profile in a tank with downward seepage is shown in Figure Q2. Calculate the total stress, pore water pressure and effective stress at points A, B and C. Hence, plot the variations of the stresses with depth. Given: \( \mathrm{H1}=4.2 \mathrm{~m}, \mathrm{H} 2=9.6 \mathrm{~m}, \mathrm{~h}=4.2 \mathrm{~m}, \mathrm{z}=5.8 \mathrm{~m}, \mathrm{e}=0.67, \mathrm{Gs}=2.64 \) Figure Q2