Home /
Expert Answers /
Earth Sciences /
isobaric-map-coding-and-decoding-of-air-pressure-data-on-weather-maps-for-each-weather-station-show-pa886
(Solved): Isobaric Map Coding and Decoding of Air Pressure Data on Weather Maps For each weather station show ...
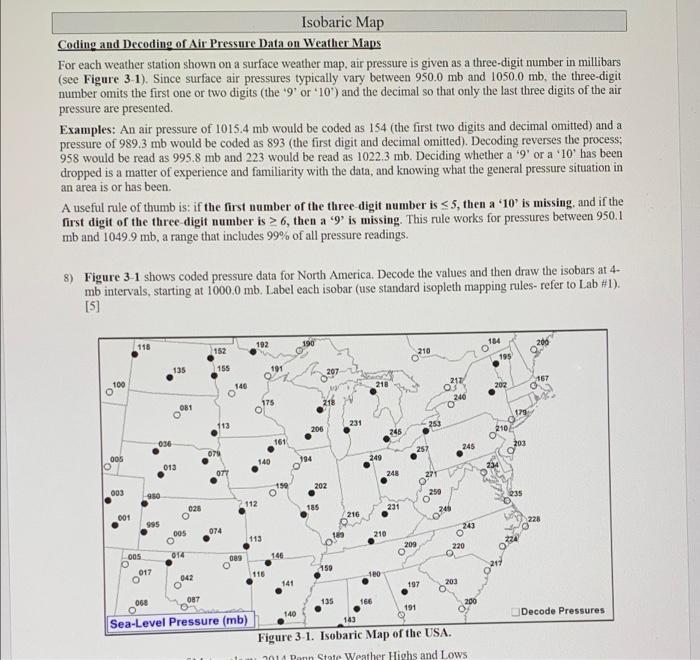
Isobaric Map Coding and Decoding of Air Pressure Data on Weather Maps For each weather station shown on a surface weather map, air pressure is given as a three-digit number in millibars (see Figure 3-1). Since surface air pressures typically vary between 950.0 mb and 1050.0 mb, the three-digit number omits the first one or two digits (the '9' or '10') and the decimal so that only the last three digits of the air pressure are presented. Examples: An air pressure of 1015.4 mb would be coded as 154 (the first two digits and decimal omitted) and a pressure of 989.3 mb would be coded as 893 (the first digit and decimal omitted). Decoding reverses the process; 958 would be read as 995.8 mb and 223 would be read as 1022.3 mb. Deciding whether a '9' or a '10' has been dropped is a matter of experience and familiarity with the data, and knowing what the general pressure situation in an area is or has been. A useful rule of thumb is: if the first number of the three-digit number is ?5, then a '10' is missing, and if the first digit of the three-digit number is 26, then a '9' is missing. This rule works for pressures between 950.1 mb and 1049.9 mb, a range that includes 99% of all pressure readings. 8) Figure 3-1 shows coded pressure data for North America. Decode the values and then draw the isobars at 4- mb intervals, starting at 1000.0 mb. Label each isobar (use standard isopleth mapping rules- refer to Lab #1). [5] 118 192 190 184 152 210 100 005 O 003 001 005 017 O 036 950 995 135 013 081 005 O 2014 028 042 155 113 074 146 089 112 087 068 Sea-Level Pressure (mb) 175 191 140 113 116 161 150 146 206 141 194 202 185 189 231 216 249 210 245 100 248 231 209 197 253 259 O 246 245 159 203 135 166 191 140 143 Figure 3-1. Isobaric Map of the USA. 2014 Pann State Weather Highs and Lows 30 220 195 202 210/ 235 228 Decode Pressures
Expert Answer
8) Figure 3-1 shows coded pressure data for North America. Decode the values and then draw the isobars at