Home /
Expert Answers /
Computer Science /
in-linear-regression-you-have-used-the-so-called-mse-l2-loss-which-is-plotted-in-the-figure-as-t-pa320
(Solved): In linear regression you have used the so called MSE (L2) loss which is plotted in the figure as t ...
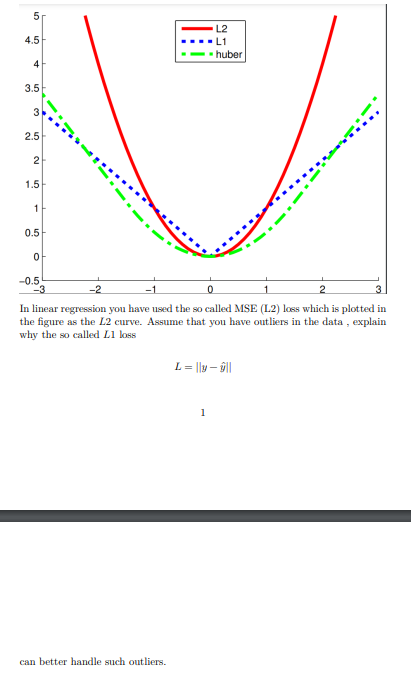
In linear regression you have used the so called MSE (L2) loss which is plotted in the figure as the L2 curve. Assume that you have outliers in the data, explain why the so called \( L 1 \) boss \[ L=\|y-\hat{y}\| \] 1 can better handle such outliers.
Expert Answer
Let's understand what L1, L2 & Outliers are: Outliers: The values which are pres