Home /
Expert Answers /
Chemistry /
identify-the-species-represented-by-each-curve-in-the-fractional-composition-diagram-of-a-monoprot-pa644
(Solved): Identify the species represented by each curve in the fractional composition diagram of a monoprot ...
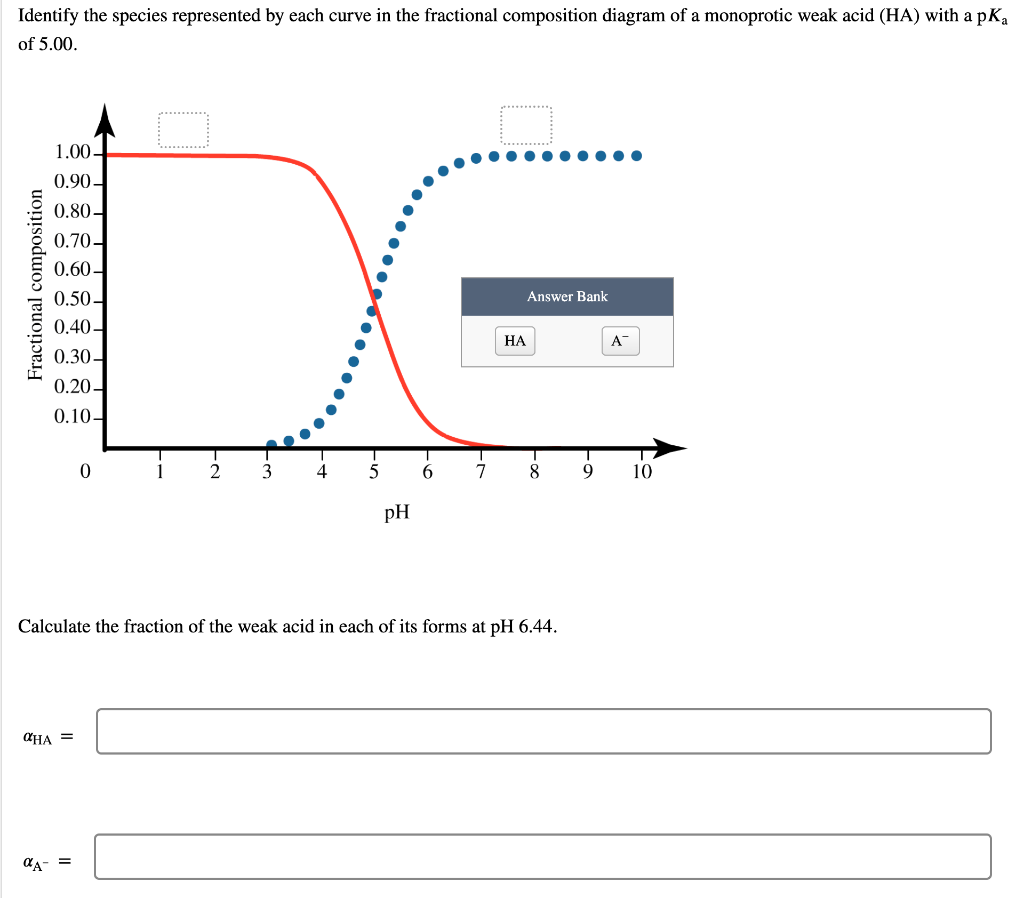
Identify the species represented by each curve in the fractional composition diagram of a monoprotic weak acid (HA) with a pKa of 5.00. Fractional composition DE HA 4 1.00- ?? 0.90- 0.80- 0.70- 0.60- 0.50- 0.40- 0.30- 0.20- 0.10- ?HA = 0 = pH 6 7 Calculate the fraction of the weak acid in each of its forms at pH 6.44. Answer Bank 8 10