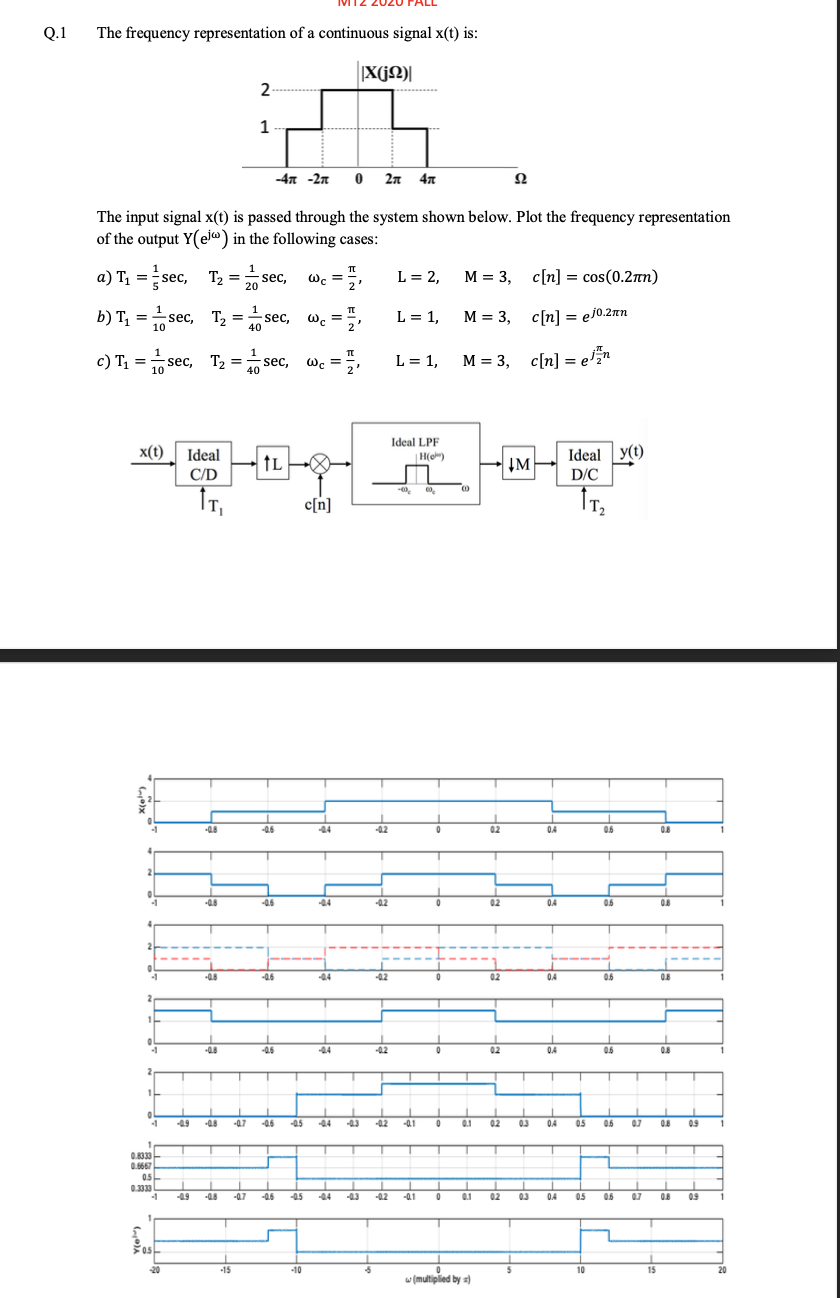
(Solved): i want a matlap code to plots this signals showen below for case (a) only i want every steps C/D u ...
i want a matlap code to plots this signals showen below for case (a) only i want every steps C/D up sampling and Down the solution of thre plots in every steps in case (a) is showen below i need the code that plots these steps Q. 1 The frequency representation of a continuous signal
x(t)is: The input signal
x(t)is passed through the system shown below. Plot the frequency representation of the output
Y(e^(j\omega ))in the following cases: a)
T_(1)=(1)/(5)sec,
T_(2)=(1)/(20)sec,
\omega _(c)=(\pi )/(2)
L=2,
M=3,c[n]=cos(0.2\pi n)b)
T_(1)=(1)/(10)sec,
T_(2)=(1)/(40)sec,
\omega _(c)=(\pi )/(2)
L=1,
M=3,c[n]=e^(j0.2\pi n)c)
T_(1)=(1)/(10)sec,
T_(2)=(1)/(40)sec,
\omega _(c)=(\pi )/(2)
L=1,M=3,c[n]=e^(j(\pi )/(2)n)
