Home /
Expert Answers /
Economics /
help-the-graph-shown-represents-the-cost-and-revenue-curves-faced-by-a-monopoly-which-of-the-follow-pa707
(Solved): help The graph shown represents the cost and revenue curves faced by a monopoly. Which of the follow ...
help
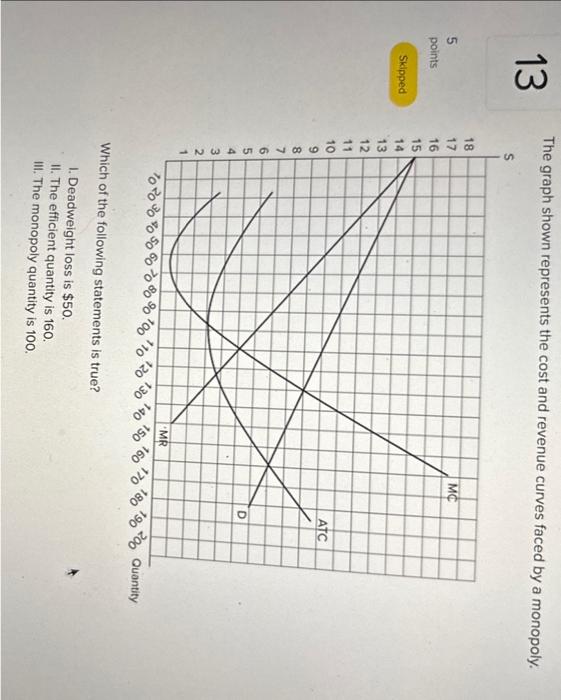
The graph shown represents the cost and revenue curves faced by a monopoly. Which of the following statements is true? I. Deadweight loss is \( \$ 50 \). II. The efficient quantity is 160 . III. The monopoly quantity is 100 .
Expert Answer
Option i) Deadweight loss is $50 deadweight loss = 0.5 x (monopoly price - monopoly MC) x( efficient quantity - monopoly quantity ) deadweight loss =