Home /
Expert Answers /
Advanced Math /
given-the-graph-of-y-f-x-shown-as-a-red-dashed-curve-drag-the-green-movable-points-to-draw-the-gr-pa815
(Solved): Given the graph of y=f(x), shown as a red dashed curve, drag the green movable points to draw the gr ...
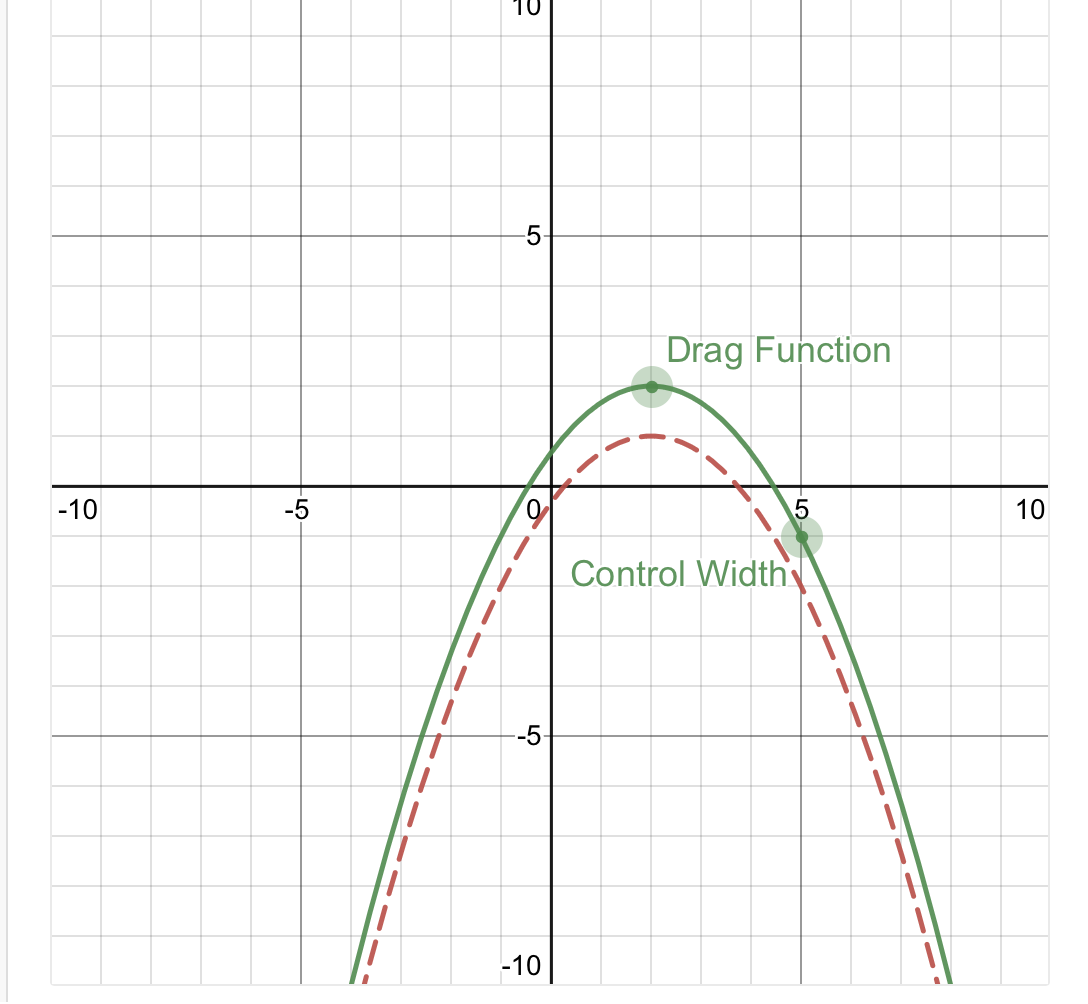
Given the graph of y=f(x), shown as a red dashed curve, drag the green movable points to draw the graph of y=f(?x). Notice that you can control the positioning of the reflective function with the coordinate labeled "Drag Function" and control the width of the reflection with the coordinate labeled "Control Width."
Expert Answer
To draw a graph of f(-x) from a graph of f(x), you can use the f