Home /
Expert Answers /
Mechanical Engineering /
from-the-list-in-table-3-2-develop-a-cause-and-effect-diagram-to-visualize-all-the-potential-issue-pa306
(Solved): From the list in Table 3.2, develop a cause-and-effect diagram to visualize all the potential issue ...
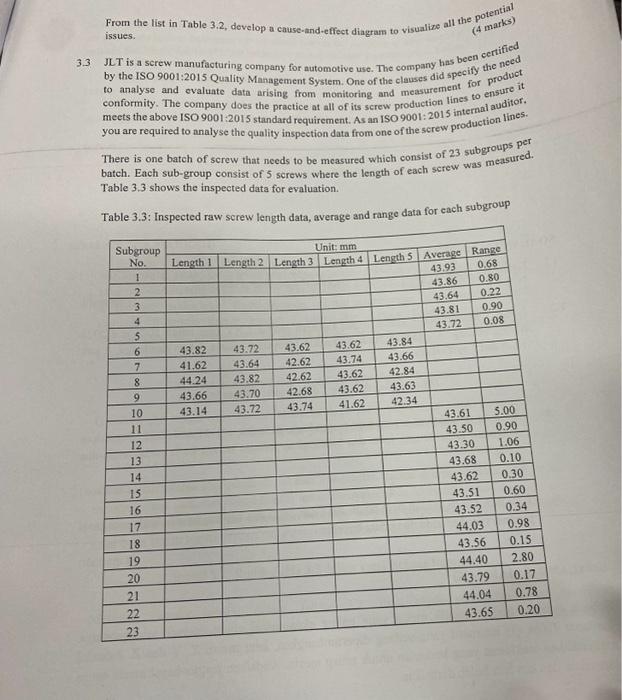
From the list in Table 3.2, develop a cause-and-effect diagram to visualize all the potential issues. 3.3. JL is a screw manufacturing company for automotive use. The corwpany has been eertified by the ISO 9001:2015 Quality Management System. One of the clauses did specify the need to analyse and evaltate data arising from monitoring and measurement for product conformity. The company does the practice at all of its screw production lines to ensure it meets the above ISO \( 9001: 2015 \) standard requirement. As an ISO \( 9001: 2015 \) internal auditor. you are required to analyse the quality inspection data from one of the screw production lines. There is one batch of screw that needs to be measured which consist of 23 subgroups per batch. Each sub-group consist of 5 screws where the length of each serew was measured. Table \( 3.3 \) shows the inspected data for evaluation. Table 3.3: Inspected raw serew length data, average and range daha for cach subgroup
Expert Answer
A potential cause-and-effect diagram for the issues listed in Table 3.2 could be as follows: Raw material quali