Home /
Expert Answers /
Statistics and Probability /
find-the-expected-count-and-the-contribution-to-the-chi-square-statistic-for-the-group-1-yes-pa982
(Solved): .,, Find the expected count and the contribution to the chi-square statistic for the (Group 1, Yes) ...

.,,
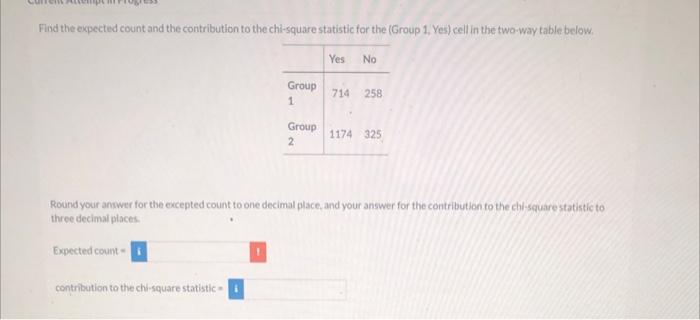
Find the expected count and the contribution to the chi-square statistic for the (Group 1, Yes) cell in the two-way table below. Round your answer for the excepted count to one decimal place, and your answer for the contribution to the chl-squarestatistic to three decimal places. Expected count = contribution to the chi-square statistic =
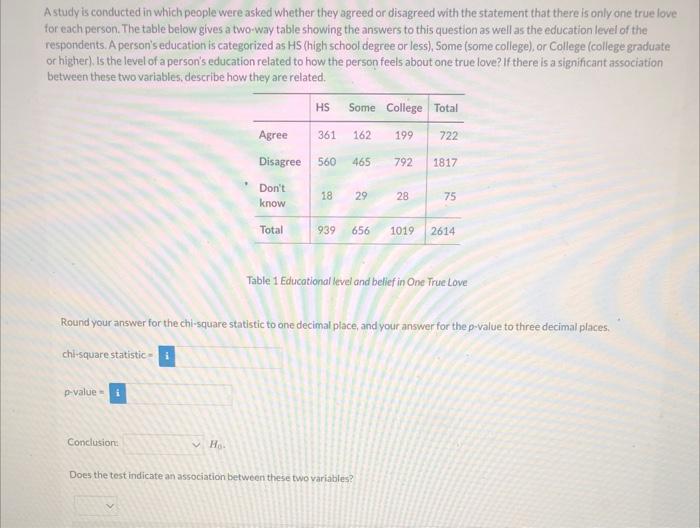
A study is conducted in which people were asked whether they agreed or disagreed with the statement that there is only one true love for each person. The table below gives a two-way table showing the answers to this question as well as the education level of the respondents. A person's education is categorized as HS (high school degree or less), Some (some college), or College (college graduate or higher). Is the level of a person's education related to how the person feels about one true love? If there is a significant association between these two variables, describe how they are related. Table 1 Educational level and belief in One True Love Round your answer for the chi-square statistic to one decimal place, and your answer for the p-value to three decimal places. chi-square statistic = p-value = Conclusion: \( \mathrm{H}_{0-} \) Does the test indicate an association between these two variables?
ERNETKSSAND WATTWIICMUSCUES reerchm anly included the contmol group. rexpected count, and the bottom mumber h the critr zution to the ch-squire statisti three escimal plases.
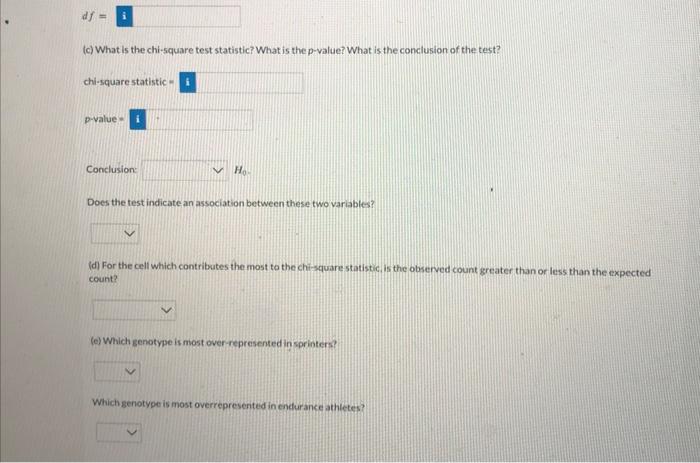
(c) What is the chi-square test statistic? What is the p-value? What is the conclusion of the test? chi-square statistic = p-value = Conclusion: \( H_{0-1} \) Does the test indicate an association between these two variables? (d) For the cell which contributes the most to the chi-square statistic. is the observed count greater than or less than the expected count? (e) Which genotype is most over-represented in sprinters? Which genotype is most overrepresented in enchurance athietes?
Expert Answer
Question 1. Following are the given data: ----- Yes No Group 1 714 258 Group 2 1174 325