Home /
Expert Answers /
Mechanical Engineering /
figure-below-is-a-plot-of-logarithm-of-the-diffusion-coefficient-versus-the-reciprocal-of-absolute-pa437
(Solved): Figure below is a plot of logarithm of the diffusion coefficient versus the reciprocal of absolute ...
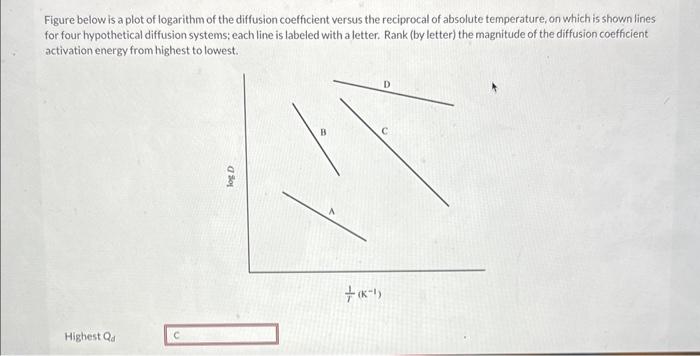
Figure below is a plot of logarithm of the diffusion coefficient versus the reciprocal of absolute temperature, on which is shown lines for four hypothetical diffusion systems; each line is labeled with a letter. Rank (byletter) the magnitude of the diffusion coefficient activation energy from highest to lowest.
Expert Answer
Diffusion Coefficient Activation Energy of B > C > A > D. The Highest Activation Energy is for B and lowest is for D.