Home /
Expert Answers /
Electrical Engineering /
figure-6-shows-the-voltage-divider-bias-method-draw-the-d-c-load-line-and-determine-the-operating-p-pa216
(Solved): Figure 6 shows the voltage divider bias method. Draw the D.C Load Line and determine the operating p ...
Figure 6 shows the voltage divider bias method. Draw the D.C Load Line and determine the operating point. Assume the transistor to be silicon.
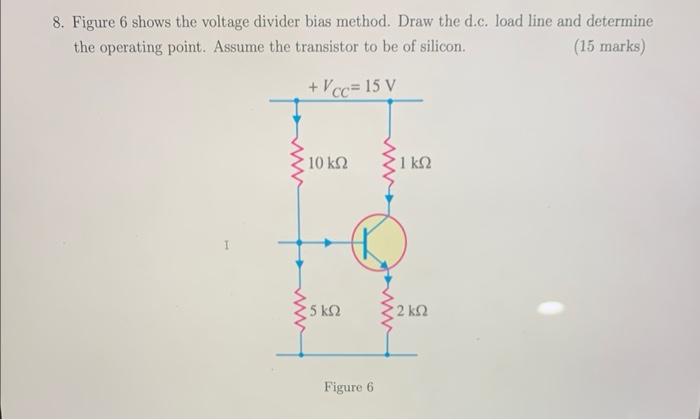
8. Figure 6 shows the voltage divider bias method. Draw the d.c. load line and determine the operating point. Assume the transistor to be of silicon. (15 marks) Frgure 0