Home /
Expert Answers /
Economics /
figure-2-10-shows-the-production-possibilities-frontiers-for-tahiti-and-bora-bora-each-country-pro-pa633
(Solved): Figure 2-10 shows the production possibilities frontiers for Tahiti and Bora Bora. Each country pro ...
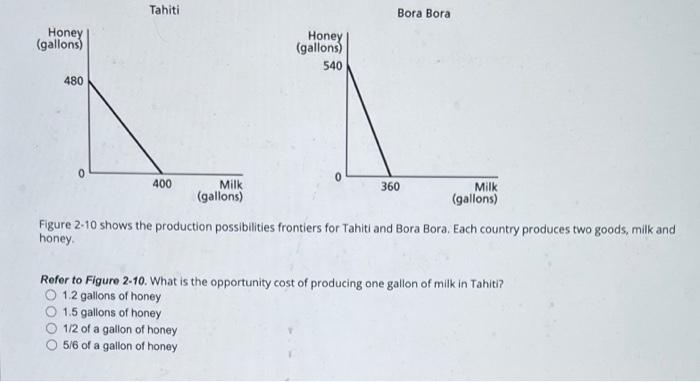
Figure 2-10 shows the production possibilities frontiers for Tahiti and Bora Bora. Each country produces two goods, milk and honey. Refer to Figure 2-10. What is the opportunity cost of producing one gallon of milk in Tahiti? \( 1.2 \) gallons of honey 1.5 gallons of honey \( 1 / 2 \) of a gallon of honey \( 5 / 6 \) of a gallon of honey
Expert Answer
From the graph we get, Opportunity co