Home /
Expert Answers /
Civil Engineering /
figure-1-shows-the-v1-graph-to-illustrate-the-velocity-of-a-car-figure-1-the-v-t-graph-a-dra-pa333
Expert Answer
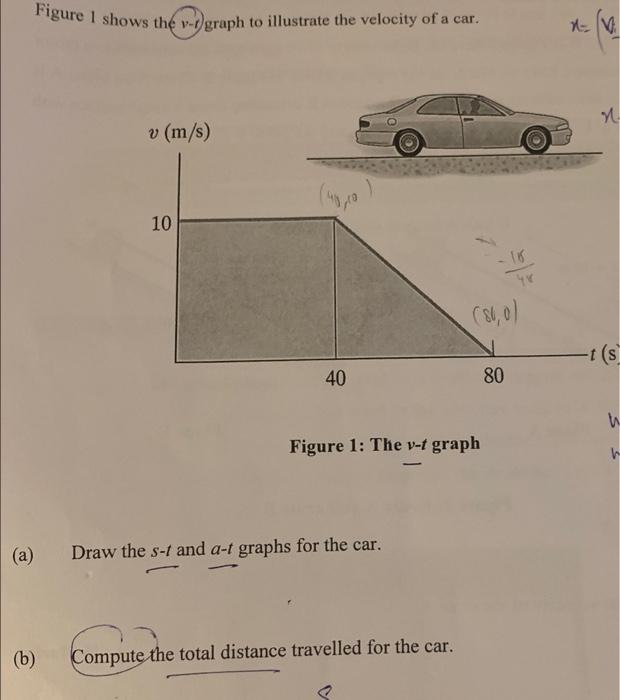
The total distance can be calculated using the equation: distance = (initial velocity x