Home /
Expert Answers /
Physics /
figure-1-is-the-position-versus-time-graph-for-a-moving-object-what-is-the-object-39-s-average-vel-pa129
(Solved): (Figure 1) is the position-versus-time graph for a moving object. What is the object's average vel ...
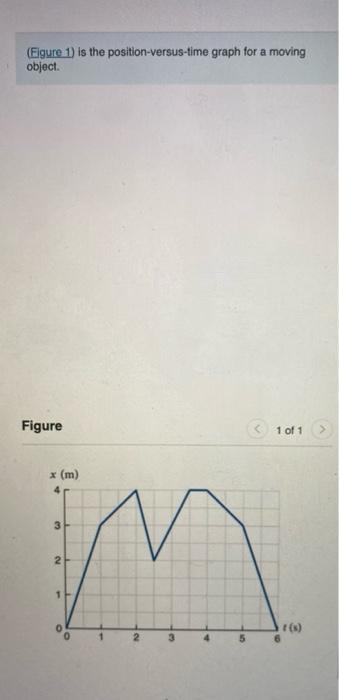
(Figure 1) is the position-versus-time graph for a moving object.
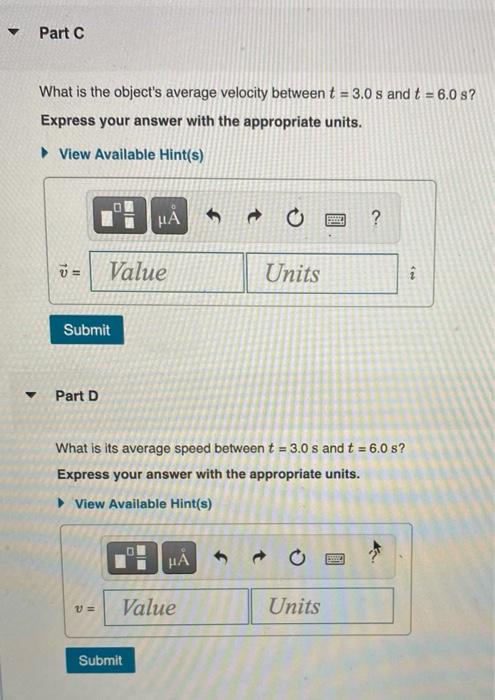
What is the object's average velocity between \( t=3.0 \mathrm{~s} \) and \( t=6.0 \mathrm{~s} \) ? Express your answer with the appropriate units. Part D What is its average speed between \( t=3.0 \mathrm{~s} \) and \( t=6.0 \mathrm{~s} \) ? Express your answer with the appropriate units.
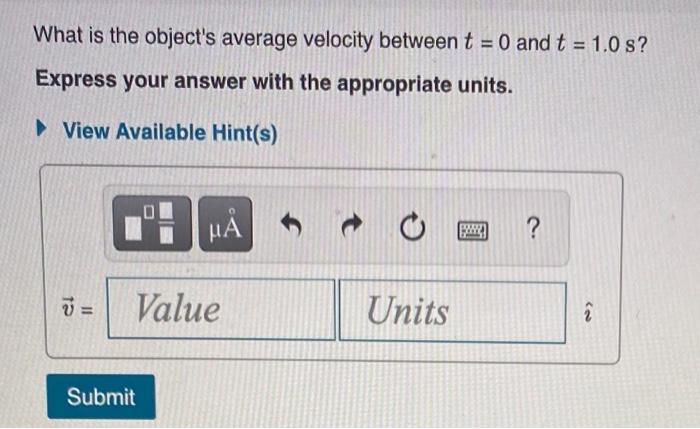
What is the object's average velocity between \( t=0 \) and \( t=1.0 \mathrm{~s} ? \) Express your answer with the appropriate units. View Available Hint(s)