Home /
Expert Answers /
Electrical Engineering /
fig-1-by-applying-the-kvl-rule-we-can-obtain-the-circuit-39-s-first-order-differential-equation-pa805
(Solved): Fig. 1 By applying the KVL rule, we can obtain the circuit's first order differential equation ...


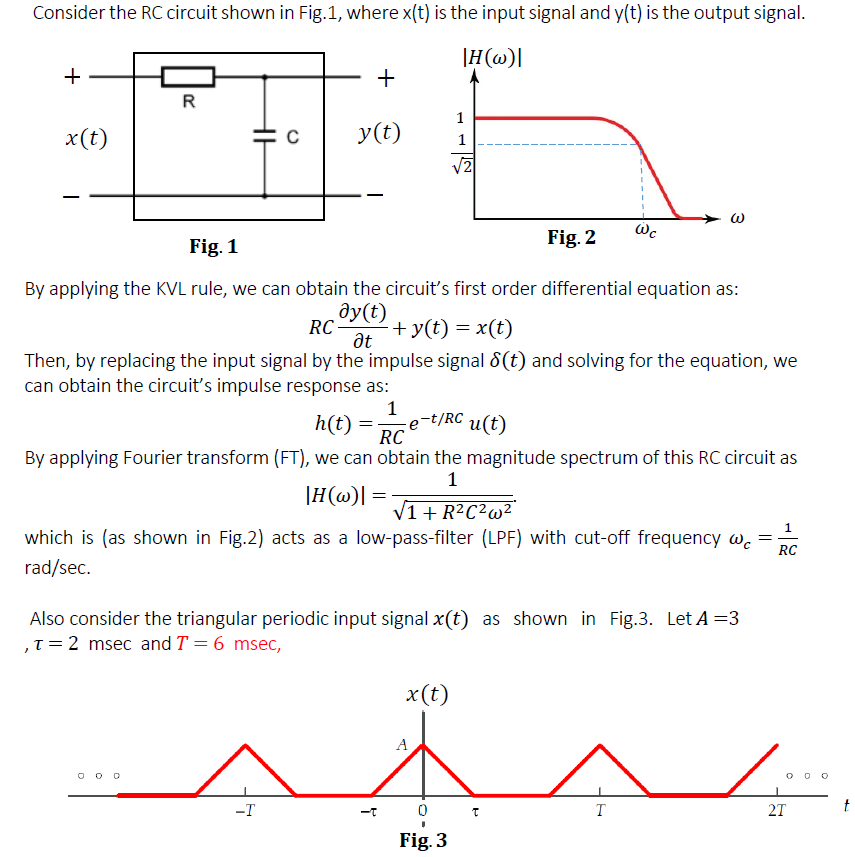
Fig. 1 By applying the KVL rule, we can obtain the circuit's first order differential equation as: Then, by replacing the input signal by the impulse signal and solving for the equation, we can obtain the circuit's impulse response as: By applying Fourier transform (FT), we can obtain the magnitude spectrum of this RC circuit as which is (as shown in Fig.2) acts as a low-pass-filter (LPF) with cut-off frequency . Also consider the triangular periodic input signal as shown in Fig.3. Let , and
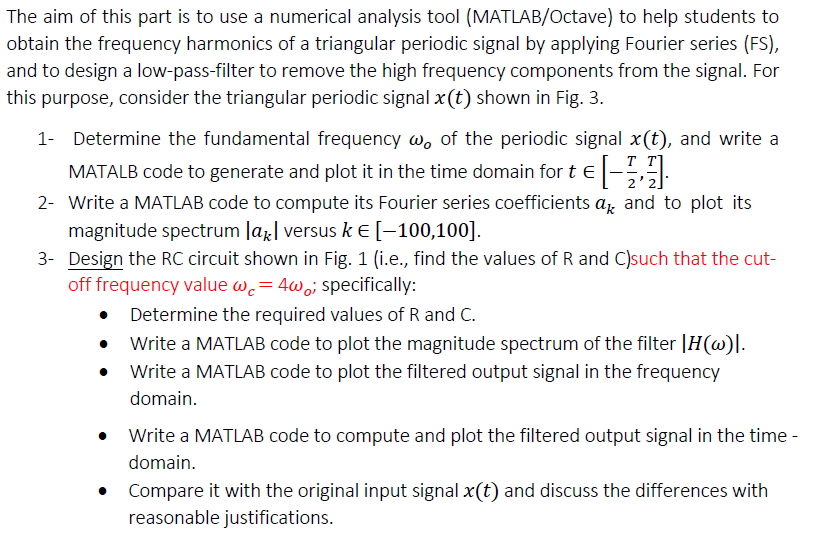
The aim of this part is to use a numerical analysis tool (MATLAB/Octave) to help students to obtain the frequency harmonics of a triangular periodic signal by applying Fourier series (FS), and to design a low-pass-filter to remove the high frequency components from the signal. For this purpose, consider the triangular periodic signal shown in Fig. 3 . 1- Determine the fundamental frequency of the periodic signal , and write a MATALB code to generate and plot it in the time domain for . 2- Write a MATLAB code to compute its Fourier series coefficients and to plot its magnitude spectrum versus . 3- Design the RC circuit shown in Fig. 1 (i.e., find the values of R and C)such that the cutoff frequency value ; specifically: - Determine the required values of and . - Write a MATLAB code to plot the magnitude spectrum of the filter . - Write a MATLAB code to plot the filtered output signal in the frequency domain. - Write a MATLAB code to compute and plot the filtered output signal in the time domain. - Compare it with the original input signal and discuss the differences with reasonable justifications.