Home /
Expert Answers /
Earth Sciences /
examine-the-graph-of-delta-18-o-values-versus-depth-below-surface-meters-for-water-samp-pa614
(Solved): Examine the graph of \( \delta^{18} O \) values versus depth below surface (meters) for water samp ...
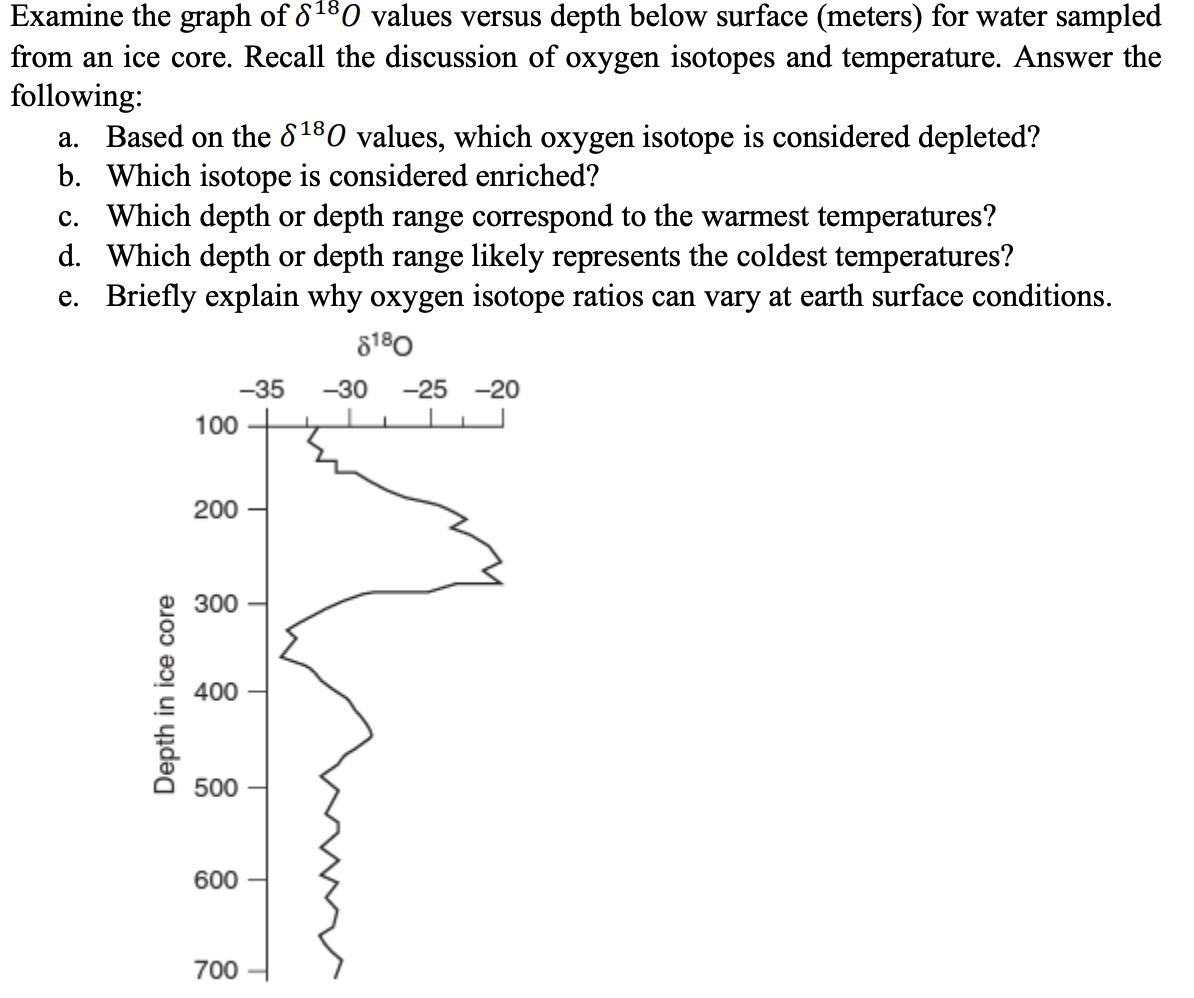
Examine the graph of \( \delta^{18} O \) values versus depth below surface (meters) for water sampled from an ice core. Recall the discussion of oxygen isotopes and temperature. Answer the following: a. Based on the \( \delta^{18} O \) values, which oxygen isotope is considered depleted? b. Which isotope is considered enriched? c. Which depth or depth range correspond to the warmest temperatures? d. Which depth or depth range likely represents the coldest temperatures? e. Briefly explain why oxygen isotope ratios can vary at earth surface conditions.
Expert Answer
?18Ois a measure of ratio between O18 and O16. Thus negative ?18O value indicates less O18 and more O16.