Home /
Expert Answers /
Statistics and Probability /
each-of-the-following-graphs-show-the-relationship-between-two-variables-determine-the-pearson-pr-pa502
(Solved): Each of the following graphs show the relationship between two variables. Determine the Pearson pr ...
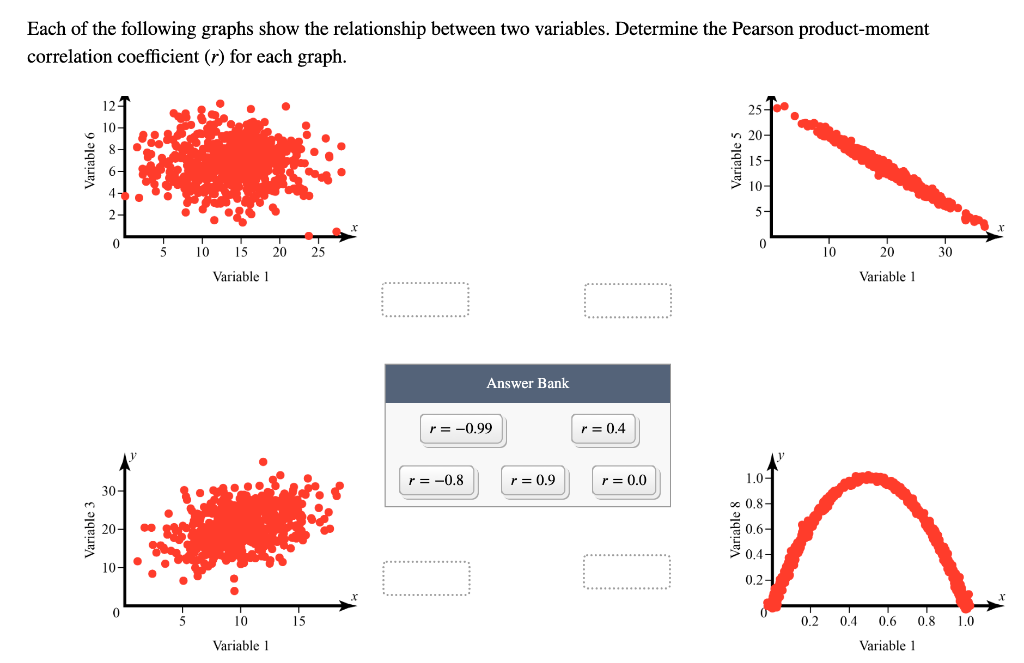
Each of the following graphs show the relationship between two variables. Determine the Pearson product-moment correlation coefficient (r) for each graph. 25 n 20- Variable Variable 5 15- 10- 5- 0 0 5 10 15 20 25 10 20 30 Variable 1 Variable 1 Answer Bank r = -0.99 r= 0.4 r= -0.8 r= 0.9 r=0.0 1.0- 30- 0 0.8- Variable 3 20- 0.6-1 0.4- 0.2 10 15 0.2 1.0 0.4 0.6 0.8 Variable 1 Variable 1