Home /
Expert Answers /
Civil Engineering /
draw-the-shear-diagram-for-beam-a-b-c-if-w-5-mathrm-kn-mathrm-m-l-12-mathrm-m-pa745
(Solved): Draw the shear diagram for beam \( A B C \) if \( w=5 \mathrm{kN} / \mathrm{m}, L=12 \mathrm{~m} \) ...
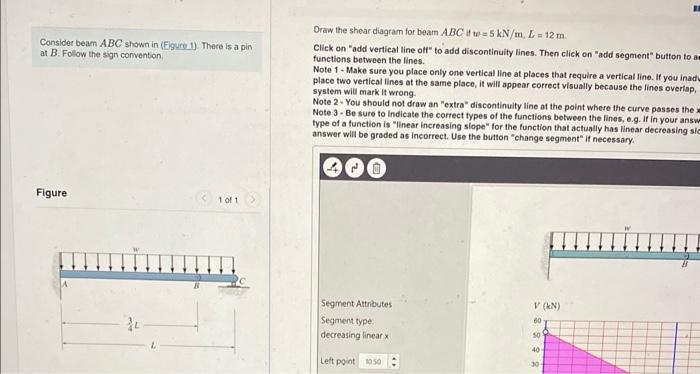
Draw the shear diagram for beam \( A B C \) if \( w=5 \mathrm{kN} / \mathrm{m}, L=12 \mathrm{~m} \). Consider beam \( A B C \) shown in (Figure 1). There is a pin at \( B \). Follow the sign convention. Click on "add vertical line olf" to add discontinuity lines. Then click on "add segment" button to a functions between the lines. Note 1 - Make sure you place only one vertical line at places that require a vertical line. If you inady place two vertical lines at the same place, it will appear correct visually because the lines overiap, system will mark it wrong. Note 2. You should not draw an "extra" discontinulty line at the point where the curve passes the \( x \) Note 3 - Be sure to Indicate the correct types of the functions between the lines, e.g. If in your answ type of a function is "linear increasing slope" for the function that actually has linear decreasing sic answer will be graded as incorrect. Use the button "change segment" if necessary.
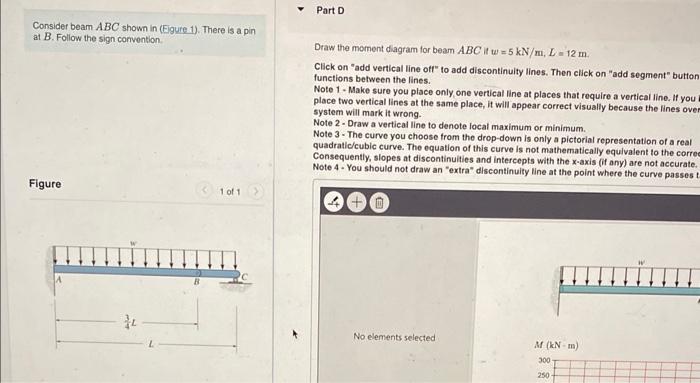
Consider beam \( A B C \) shown in (Eigure 1). There is a pin at B. Follow the sign corvention. Draw the moment diagram for beam \( A B C \) it \( w=5 \mathrm{kN} / \mathrm{m}, L=12 \mathrm{~m} \). Click on "add vertical line off" to add discontinuity lines. Then click on "add segment" button functions between the lines. Note 1- Make sure you place only one vertical line at places that require a vertical line. If you place two vertical lines at the same place, it will appear correct visually because the lines over system will mark it wrong. Note 2- Draw a vertical line to denote local maximum or minimum. Note 3- The curve you choose from the drop-down is only a pictorial representation of a real quadratic/cubic curve. The equation of this curve is not mathematically equivalent to the correConsequently, slopes at discontinuities and intercepts with the x-axis (if any) are not accurate. Note 4-You should not draw an "extra" discontinuity line at the point where the curve passes t
Expert Answer
The free body diagram of beam is shown below 3 mB Ax5 kN/m MA9 mA AyC