Home /
Expert Answers /
Electrical Engineering /
draw-the-polar-plot-from-the-separate-magnitude-and-phase-curves-shown-in-figure-bellow-0-10-20-pa694
(Solved): Draw the polar plot from the separate magnitude and phase curves shown in figure bellow 0 -10 -20 ...
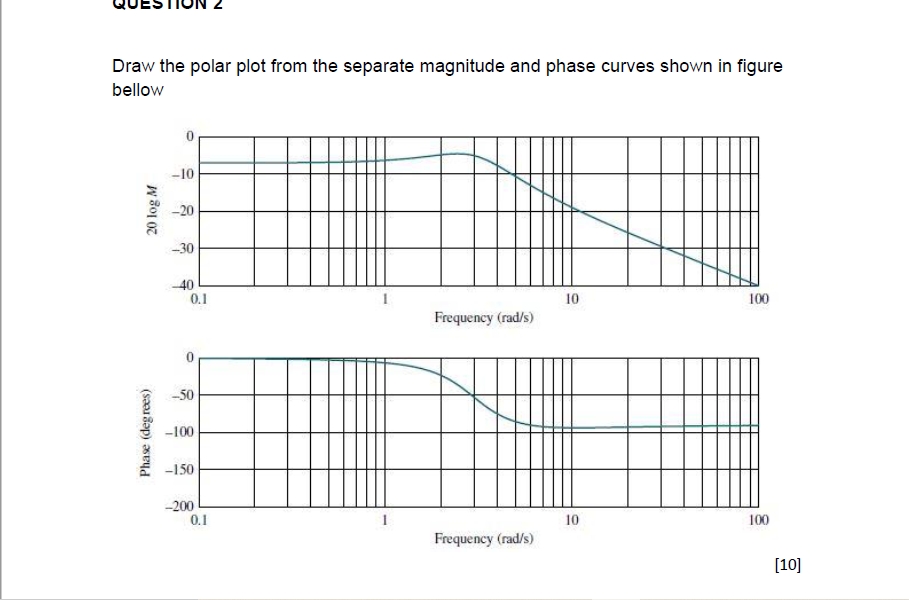
Draw the polar plot from the separate magnitude and phase curves shown in figure bellow 0 -10 -20 -30 -40 10 100 Frequency (rad/s) Frequency (rad/s) 20 log M Phase (degrees) 0.1 0 -50 -100 -150 -200 0.1 10 100 [10]
Expert Answer
Solution:_ Polar plot describes the frequency response of open loop