Home /
Expert Answers /
Civil Engineering /
draw-a-milliequivalents-per-liter-bar-graph-and-list-the-hypothetical-combinations-for-the-followi-pa402
(Solved): Draw a milliequivalents-per-liter bar graph and list the hypothetical combinations for the followi ...
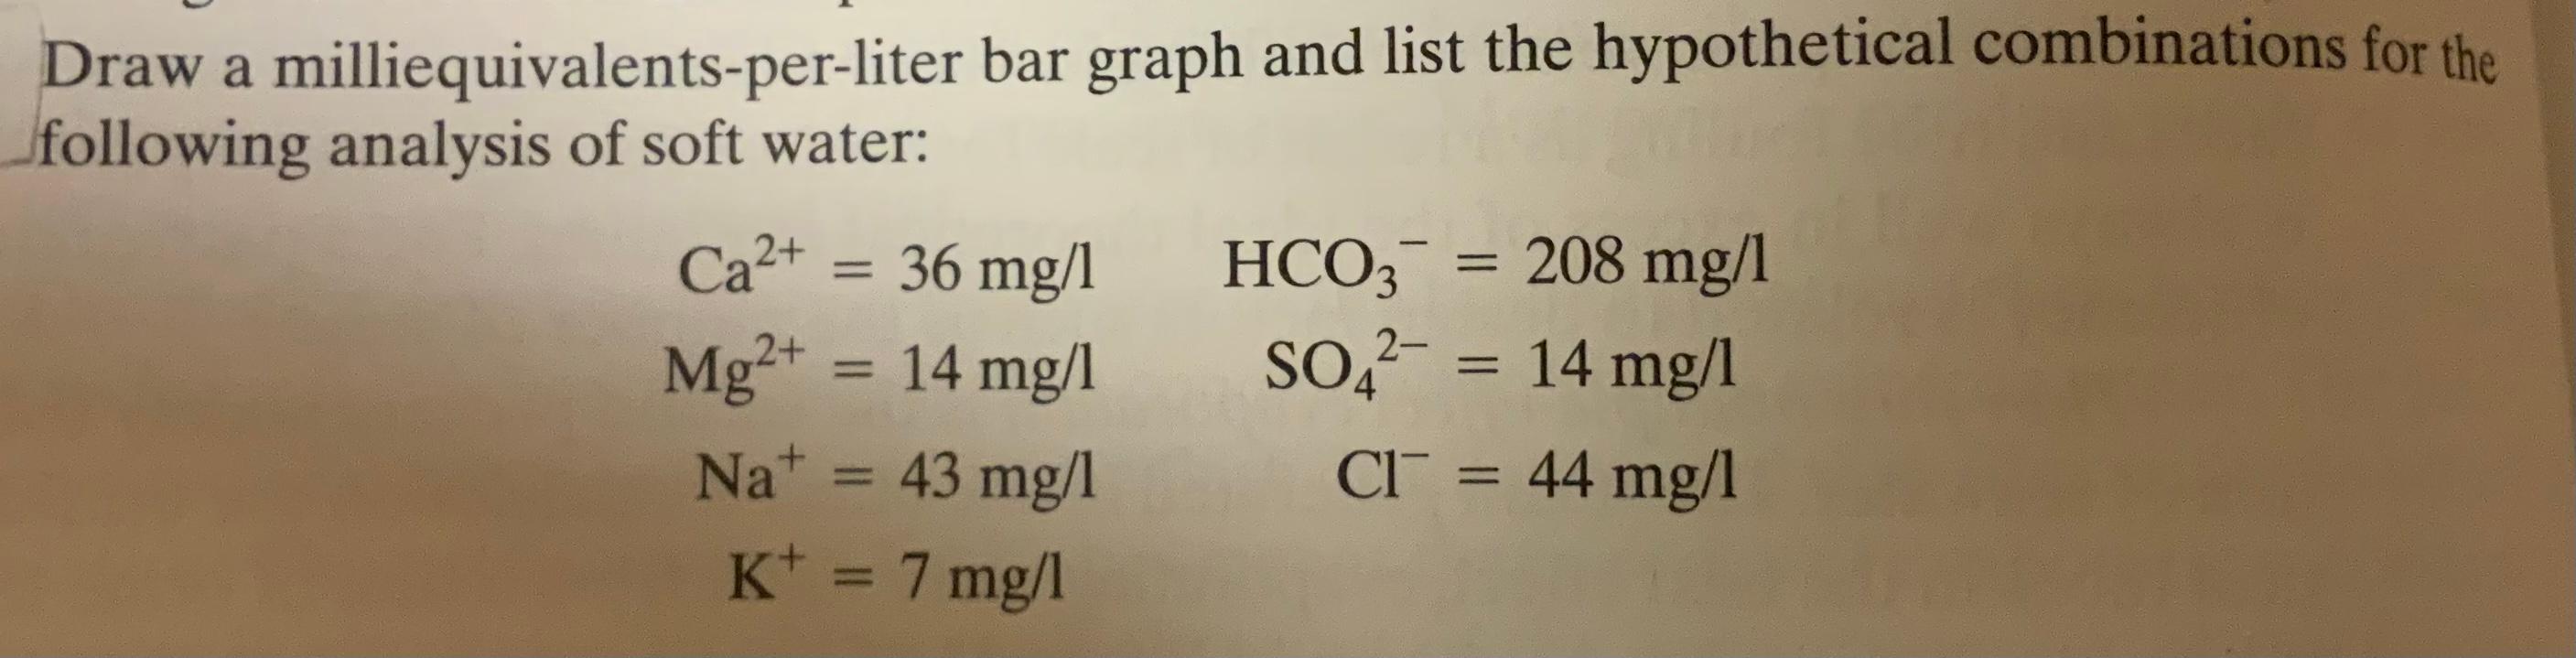
Draw a milliequivalents-per-liter bar graph and list the hypothetical combinations for the following analysis of soft water: \[ \begin{aligned} \mathrm{Ca}^{2+} &=36 \mathrm{mg} / 1 & \mathrm{HCO}_{3}^{-}=208 \mathrm{mg} / 1 \\ \mathrm{Mg}^{2+} &=14 \mathrm{mg} / \mathrm{l} & \mathrm{SO}_{4}^{2-} &=14 \mathrm{mg} / \mathrm{l} \\ \mathrm{Na}^{+} &=43 \mathrm{mg} / 1 & \mathrm{Cl}^{-} &=44 \mathrm{mg} / \mathrm{l} \\ \mathrm{K}^{+} &=7 \mathrm{mg} / \mathrm{l} & & \end{aligned} \]
Expert Answer
Ans: milliequivalent=concentration/e