Home /
Expert Answers /
Computer Science /
display-a-graph-of-your-model-of-global-plastic-production-rate-vs-years-since-1975-over-the-period-pa113
(Solved): Display a graph of your model of global plastic production rate vs. years since 1975 over the period ...
Display a graph of your model of global plastic production rate vs. years since 1975 over the period 1975—2050. Your graph should also include the data for global plastic production by year given in Section 5.1. Your model should use a solid line when interpo- lating and a dashed line when extrapolating. Use python for this question.
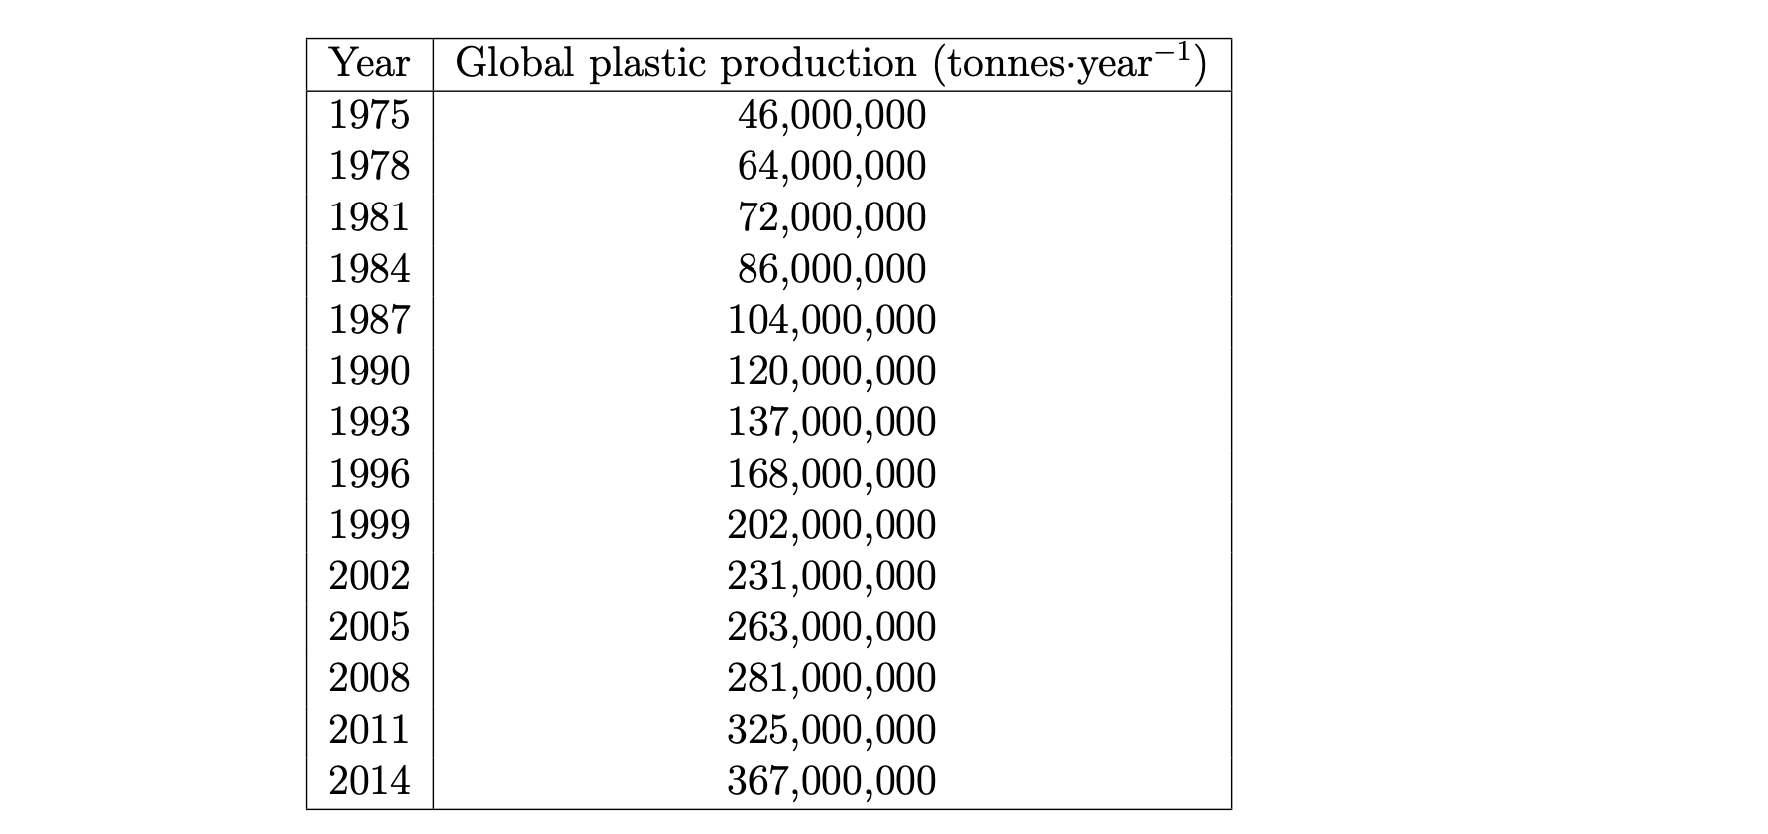
Year Global plastic production (tonnes.year-?) 1975 46,000,000 1978 64,000,000 1981 72,000,000 1984 86,000,000 1987 104,000,000 1990 120,000,000 1993 137,000,000 1996 168,000,000 1999 202,000,000 2002 231,000,000 2005 263,000,000 2008 281,000,000 2011 325,000,000 2014 367,000,000
Expert Answer
Kindly find below the solution for Times 10 Design PROGRAM: #Implementation o