Home /
Expert Answers /
Economics /
difference-plot-interpretationhow-would-you-interpret-these-plots-y-axis-is-showing-time-series-dat-pa580
(Solved): Difference plot interpretationhow would you interpret these plots. y axis is showing time series dat ...
Difference plot interpretation
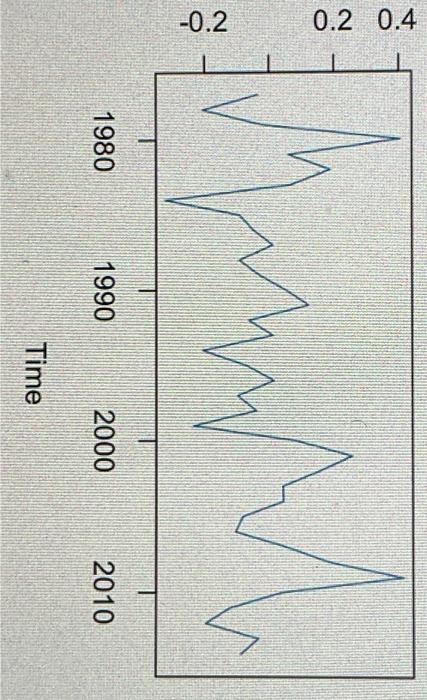
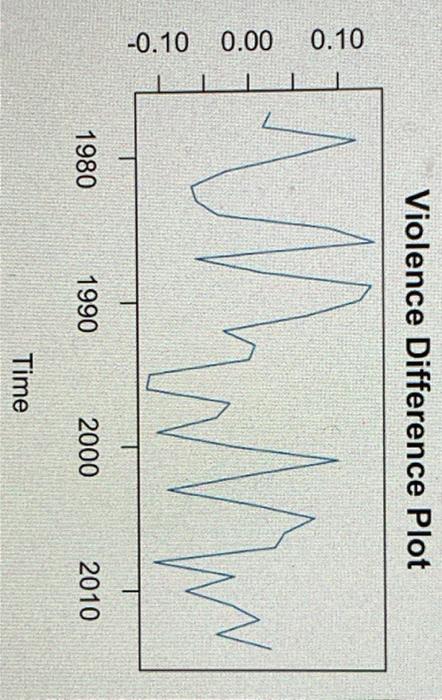
how would you interpret these plots. y axis is showing time series data while x axis is showing time. are they non stationary? etc...
0.2 0.4 -0.2 1980 1990 Time 2000 2010
0.10 0.00 -0.10 Violence Difference Plot MM 1980 1990 Time 2000 N 2010
Expert Answer
As we can see from both the plots there is