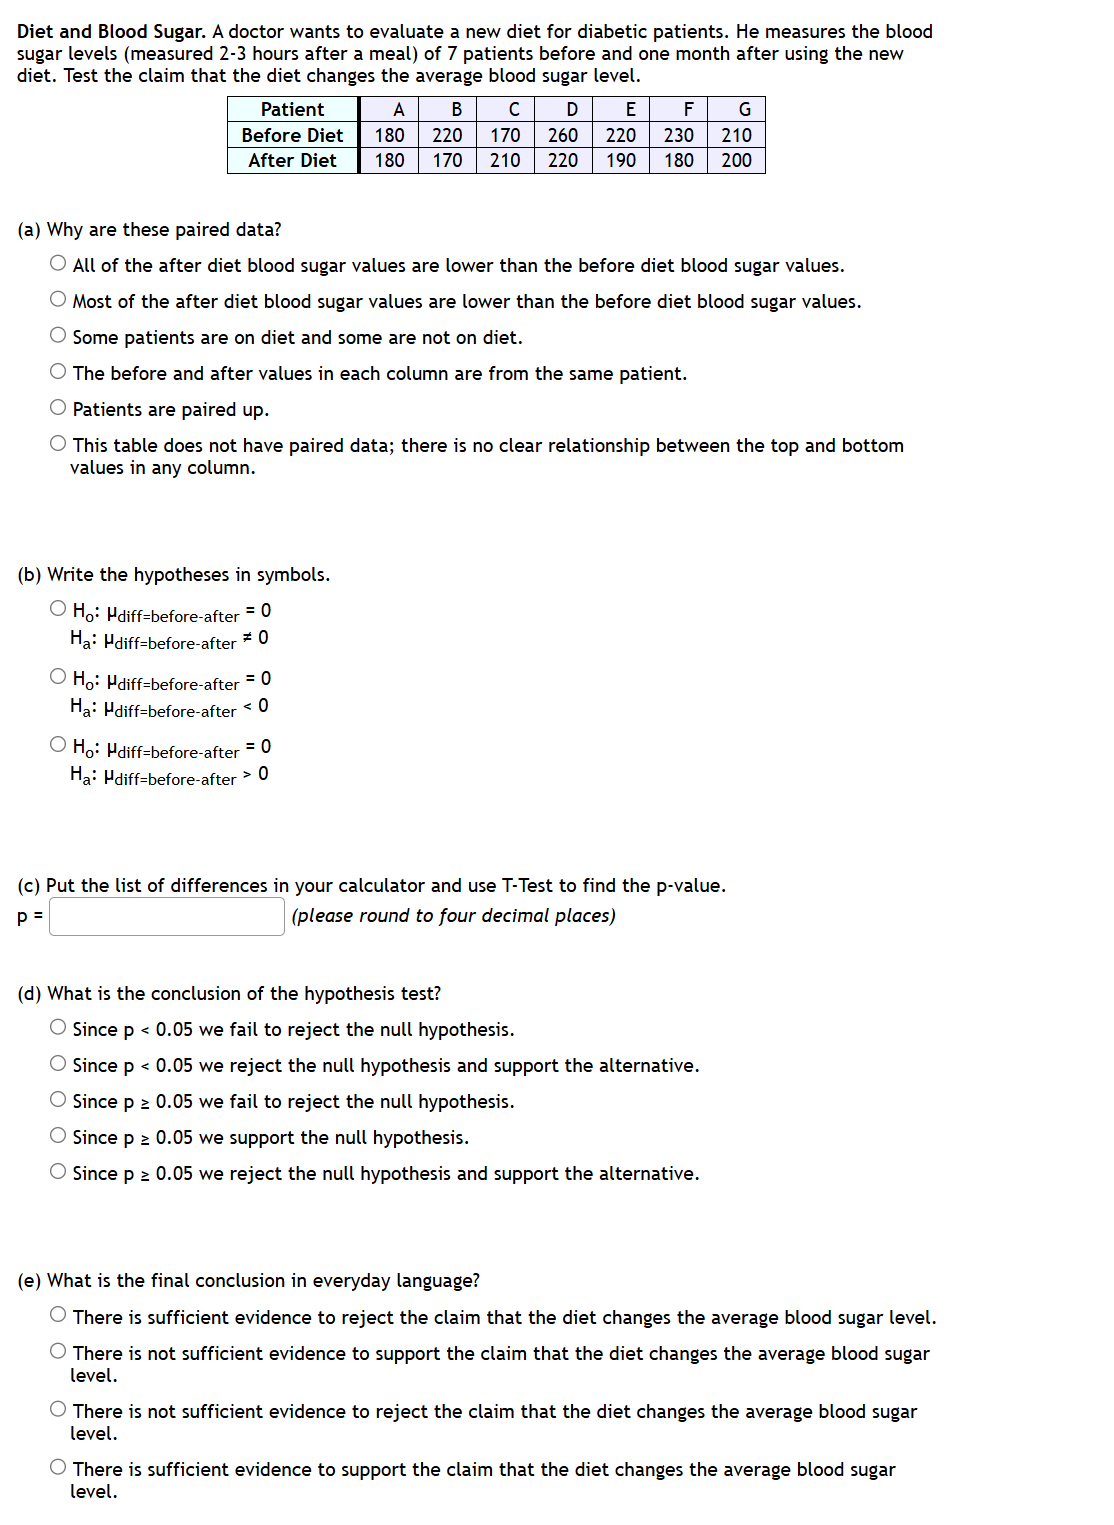
(Solved): Diet and Blood Sugar. A doctor wants to evaluate a new diet for diabetic patients. He measures the ...
Diet and Blood Sugar. A doctor wants to evaluate a new diet for diabetic patients. He measures the blood sugar levels (measured 2-3 hours after a meal) of 7 patients before and one month after using the new diet. Test the claim that the diet changes the average blood sugar level. (a) Why are these paired data? All of the after diet blood sugar values are lower than the before diet blood sugar values. Most of the after diet blood sugar values are lower than the before diet blood sugar values. Some patients are on diet and some are not on diet. The before and after values in each column are from the same patient. Patients are paired up. This table does not have paired data; there is no clear relationship between the top and bottom values in any column. (b) Write the hypotheses in symbols.
H_(0):\mu _(diff )= before-after =0
H_(a):\mu _(diff )= before-after !=0
H_(o):\mu _(diff)=before-after =0
H_(a):\mu _(diff )= before-after <0
H_(o):\mu _(diff)=before-after =0
H_(a):\mu _(diff )= before-after >0
(c) Put the list of differences in your calculator and use T-Test to find the
p-value.
p=(please round to four decimal places) (d) What is the conclusion of the hypothesis test? Since
p<0.05we fail to reject the null hypothesis. Since
p<0.05we reject the null hypothesis and support the alternative. Since
p>=0.05we fail to reject the null hypothesis. Since
P>=0.05we support the null hypothesis. Since
P>=0.05we reject the null hypothesis and support the alternative. (e) What is the final conclusion in everyday language? There is sufficient evidence to reject the claim that the diet changes the average blood sugar level. There is not sufficient evidence to support the claim that the diet changes the average blood sugar level. There is not sufficient evidence to reject the claim that the diet changes the average blood sugar level. There is sufficient evidence to support the claim that the diet changes the average blood sugar level.
