Home /
Expert Answers /
Economics /
consider-two-provinces-that-adopt-different-laws-concerning-labour-unions-the-following-graph-sho-pa867
(Solved): Consider two provinces that adopt different laws concerning labour unions. The following graph sho ...
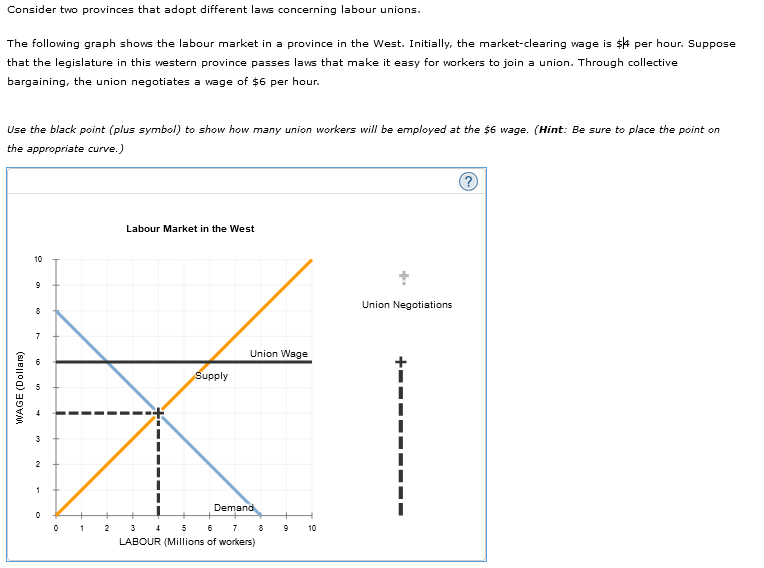
Consider two provinces that adopt different laws concerning labour unions. The following graph shows the labour market in a province in the West. Initially, the market-clearing wage is \$4 per hour. Suppose that the legislature in this western province passes laws that make it easy for workers to join a union. Through collective bargaining, the union negotiates a wage of \( \$ 6 \) per hour. Use the black point (plus symbol) to show how many union workers will be employed at the \$6 wage. (Hint: Be sure to place the point on the appropriate curve.)
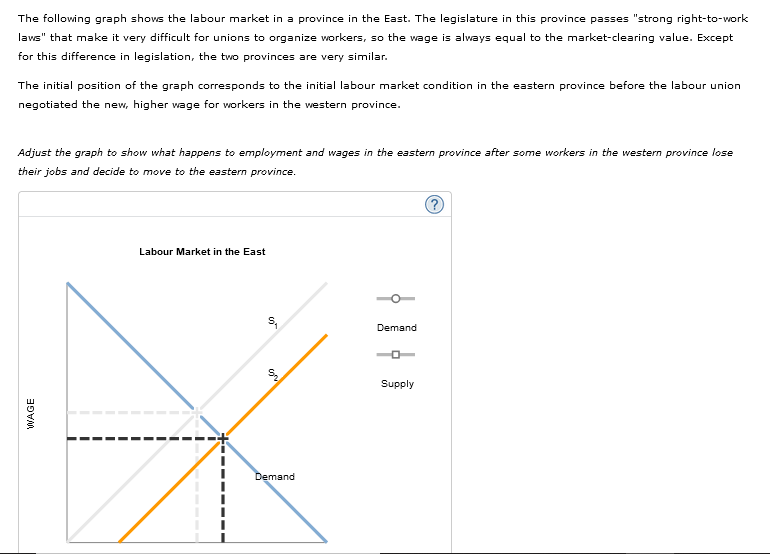
The following graph shows the labour market in a province in the East. The legislature in this province passes "strong right-to-work laws" that make it very difficult for unions to organize workers, so the wage is always equal to the market-clearing value. Except for this difference in legislation, the two provinces are very similar. The initial position of the graph corresponds to the initial labour market condition in the eastern province before the labour union negotiated the new, higher wage for workers in the western province. Adjust the graph to show what happens to employment and wages in the eastern province after some workers in the western province lose their jobs and decide to move to the eastern province.