Home /
Expert Answers /
Economics /
consider-the-market-for-designer-handbags-the-following-graph-shows-the-demand-and-supply-for-des-pa495
(Solved): Consider the market for designer handbags. The following graph shows the demand and supply for des ...
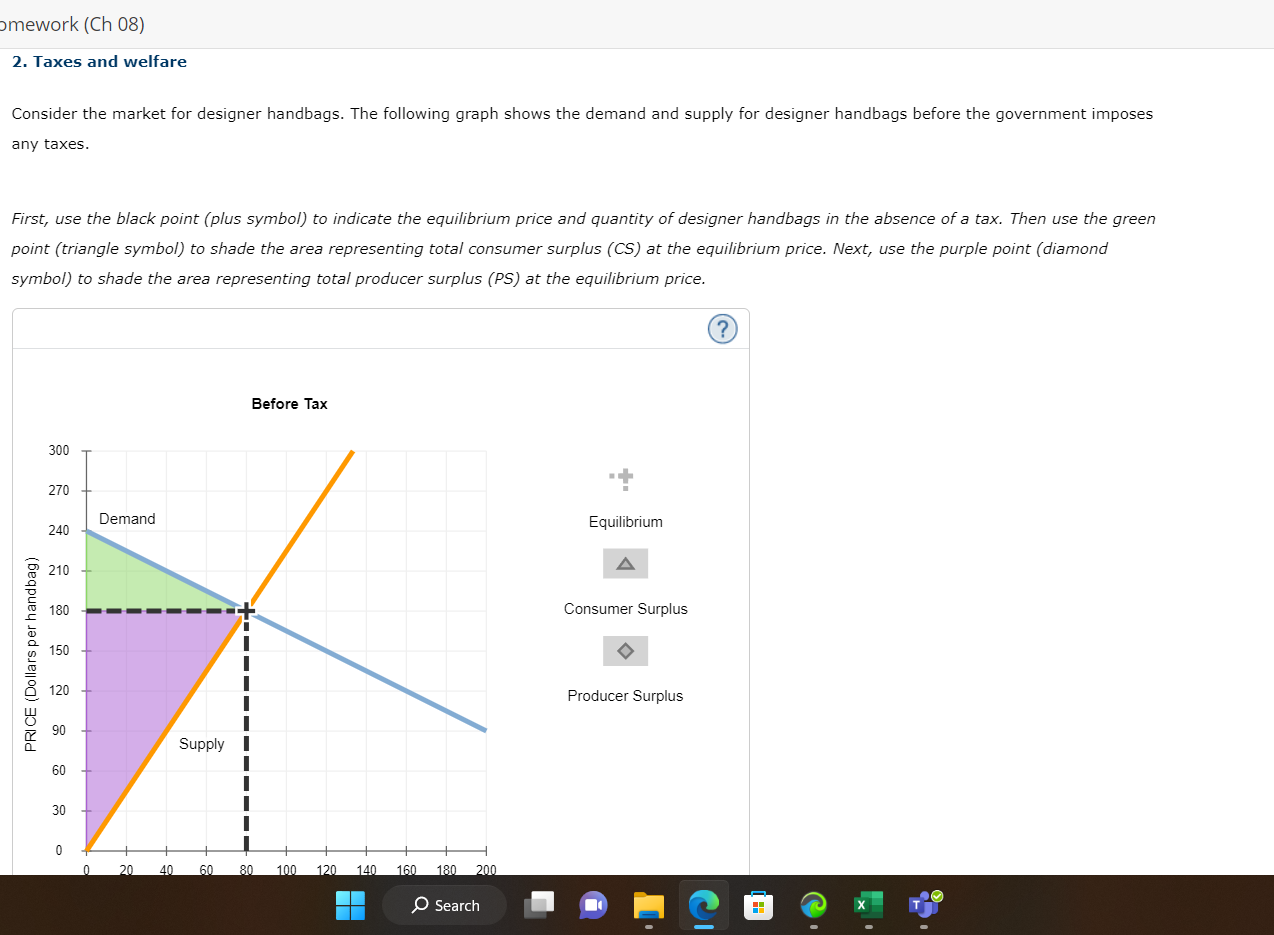
Consider the market for designer handbags. The following graph shows the demand and supply for designer handbags before the government imposes any taxes. First, use the black point (plus symbol) to indicate the equilibrium price and quantity of designer handbags in the absence of a tax. Then use the green point (triangle symbol) to shade the area representing total consumer surplus (CS) at the equilibrium price. Next, use the purple point (diamond symbol) to shade the area representing total producer surplus (PS) at the equilibrium price.
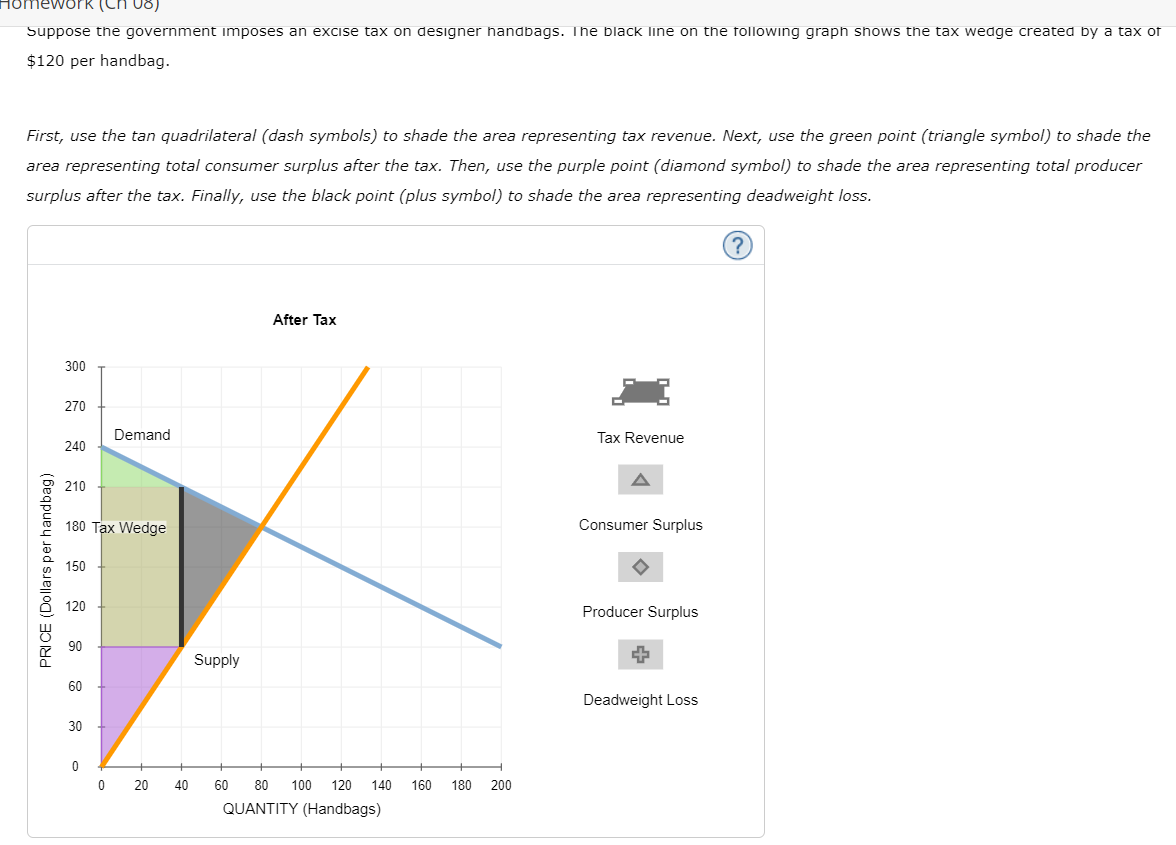
Suppose the government imposes an excise tax on designer handbags. I he black IIne on the tollowing graph shows the tax wedge created by a tax ot per handbag. First, use the tan quadrilateral (dash symbols) to shade the area representing tax revenue. Next, use the green point (triangle symbol) to shade the area representing total consumer surplus after the tax. Then, use the purple point (diamond symbol) to shade the area representing total producer surplus after the tax. Finally, use the black point (plus symbol) to shade the area representing deadweight loss.
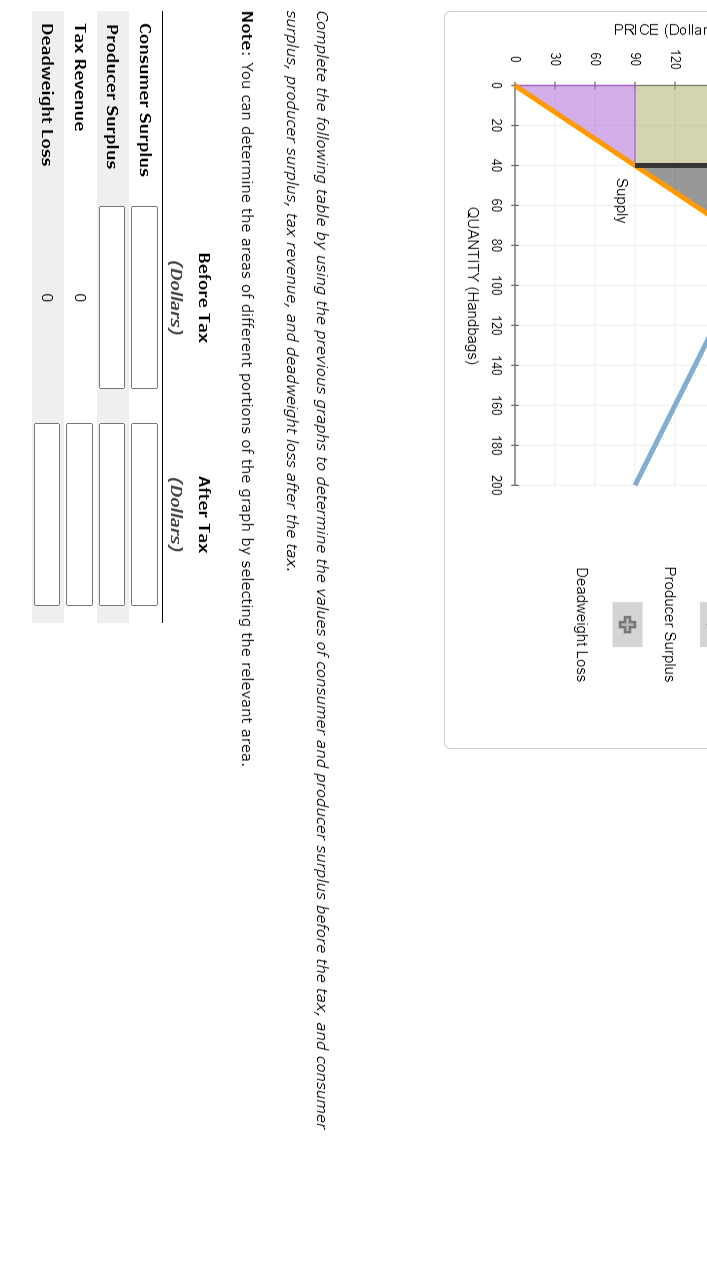
Complete the following table by using the previous graphs to determine the values of consumer and producer surplus before the tax, and consumer surplus, producer surplus, tax revenue, and deadweight loss after the tax. Note: You can determine the areas of different portions of the graph by selecting the relevant area.
Expert Answer
The first graph provided in the question statement, which deals with CS and PS before tax, is just correct. Find it again when we have labeled it bett