Home /
Expert Answers /
Economics /
consider-the-following-graph-depicting-the-smc-atc-and-avc-curves-in-the-short-run-for-a-firm-in-pa458
(Solved): Consider the following graph depicting the SMC, ATC, and AVC curves in the short run for a firm in ...
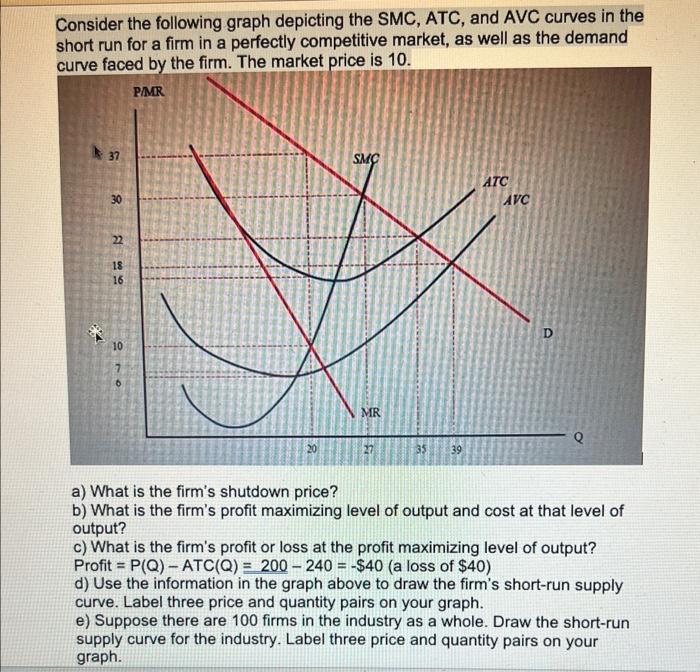
Consider the following graph depicting the SMC, ATC, and AVC curves in the short run for a firm in a perfectly competitive market, as well as the demand cinca faced hv the firm. The market price is 10. a) What is the firm's shutdown price? b) What is the firm's profit maximizing level of output and cost at that level of output? c) What is the firm's profit or loss at the profit maximizing level of output? Profit \( =P(Q)-A T C(Q)=200-240=-\$ 40 \) (a loss of \( \$ 40 \) ) d) Use the information in the graph above to draw the firm's short-run supply curve. Label three price and quantity pairs on your graph. e) Suppose there are 100 firms in the industry as a whole. Draw the short-run supply curve for the industry. Label three price and quantity pairs on your graph.
Expert Answer
a) A firm shuts down if the price falls below the minimum of AVC. Shut down Price = minimum of AVC =6