Home /
Expert Answers /
Statistics and Probability /
conceptual-overview-explore-the-sampling-distribution-of-the-difference-between-two-means-the-mea-pa780
(Solved): Conceptual Overview: Explore the sampling distribution of the difference between two means. The mea ...
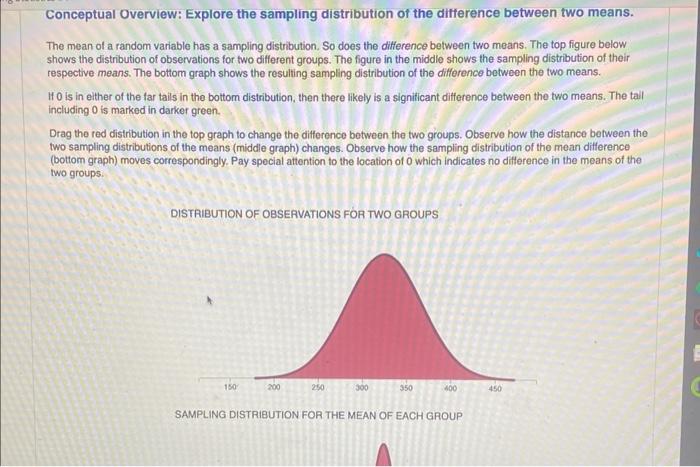
Conceptual Overview: Explore the sampling distribution of the difference between two means. The mean of a random variable has a sampling distribution. So does the difference between two means. The top figure below shows the distribution of observations for two different groups. The figure in the middle shows the sampling distribution of their respective means. The bottom graph shows the resulting sampling distribution of the difference between the two means. If 0 is in elther of the far tails in the bottom distribution, then there likely is a significant difference between the two means. The tail including 0 is marked in darker green. Drag the red distribution in the top graph to change the difference between the two groups. Observe how the distance between the two sampling distributions of the means (middle graph) changes. Observe how the sampling distribution of the mean difference (bottom graph) moves correspondingly. Pay special attention to the location of 0 which indicates no difference in the means of the two groups. DISTRIBUTION OF OBSERVATIONS FOR TWO GROUPS SAMPLING DISTRIBUTION FOR THE MEAN OF EACH GAOUP
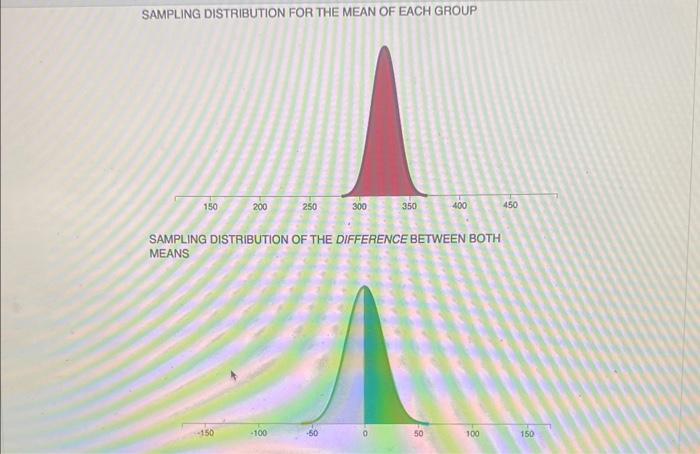
SAMPLING DISTRIBUTION FOR THE MEAN OF EACH GROUP SAMPLING DISTRIBUTION OF THE DIFFERENCE BETWEEN BOTH MEANS