Home /
Expert Answers /
Chemistry /
concentration-vs-absorbance-b-look-at-the-final-two-values-of-your-standar-pa195
(Solved): Concentration vs. Absorbance b. Look at the final two values of your standar ...
Concentration vs. Absorbance
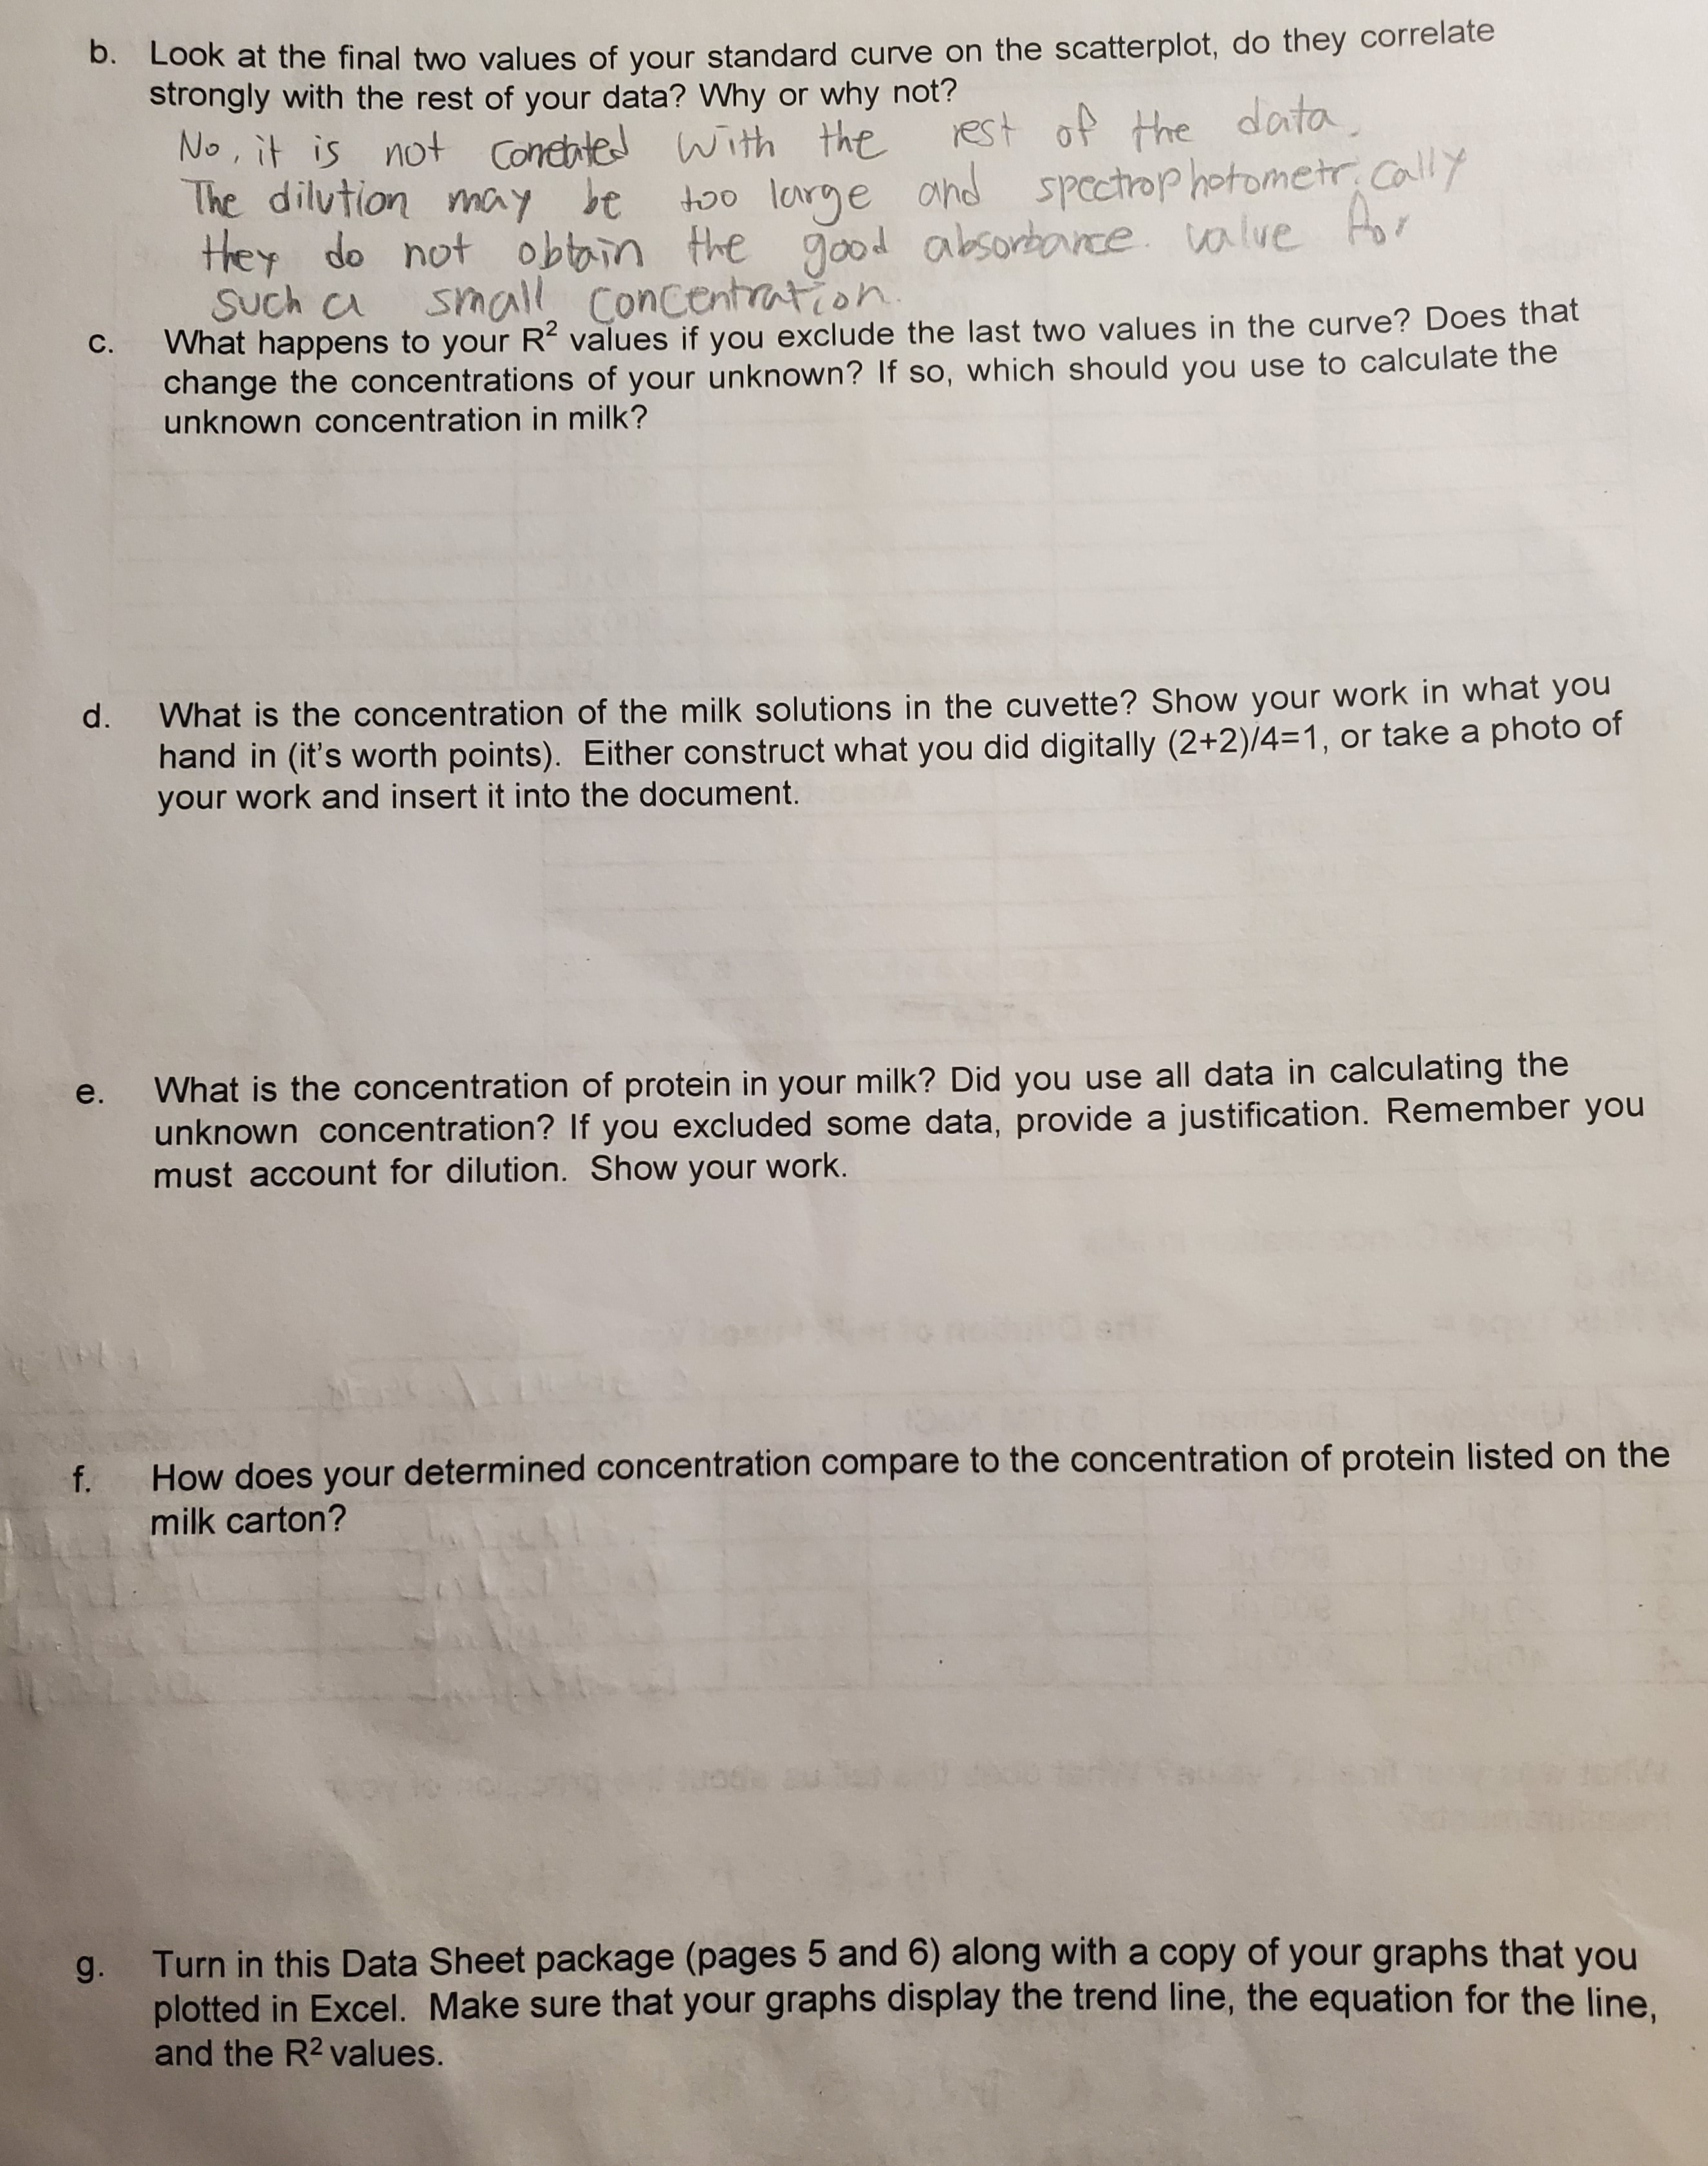
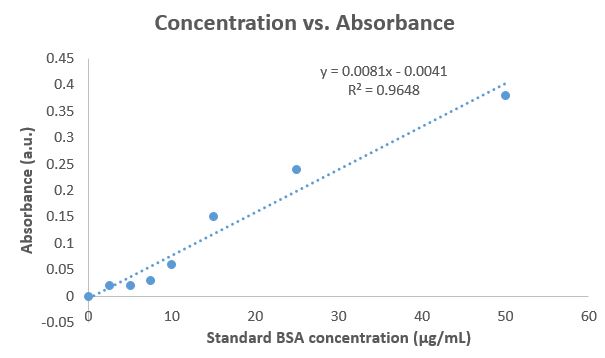
b. Look at the final two values of your standard curve on the scatterplot, do they correlate strongly with the rest of your data? Why or why not? No, it is not concated with the rest of the data. The dilution may be too large and spectrophotometr. cally they do not obtain the good absorbance. value for such a small concentration. c. What happens to your \( R^{2} \) values if you exclude the last two values in the curve? Does that change the concentrations of your unknown? If so, which should you use to calculate the unknown concentration in milk? d. What is the concentration of the milk solutions in the cuvette? Show your work in what you hand in (it's worth points). Either construct what you did digitally \( (2+2) / 4=1 \), or take a photo of your work and insert it into the document. e. What is the concentration of protein in your milk? Did you use all data in calculating the unknown concentration? If you excluded some data, provide a justification. Remember you must account for dilution. Show your work. f. How does your determined concentration compare to the concentration of protein listed on the milk carton? g. Turn in this Data Sheet package (pages 5 and 6) along with a copy of your graphs that you plotted in Excel. Make sure that your graphs display the trend line, the equation for the line, and the \( R^{2} \) values.
Expert Answer
From the above graph — b) No, because they do not correlate well to the rest of the data. The dilution may be way too much and spectrophotometrically they do not