Home /
Expert Answers /
Computer Science /
can-someone-help-me-fix-this-code-it-is-for-my-bioelectricity-class-it-says-that-the-variable-appe-pa371
(Solved): Can someone help me fix this code? it is for my bioelectricity class. It says that the variable appe ...
Can someone help me fix this code? it is for my bioelectricity class. It says that the variable appears to change size on every loop iteration. also, im trying to get my data to display but i don't understand why it isnt.
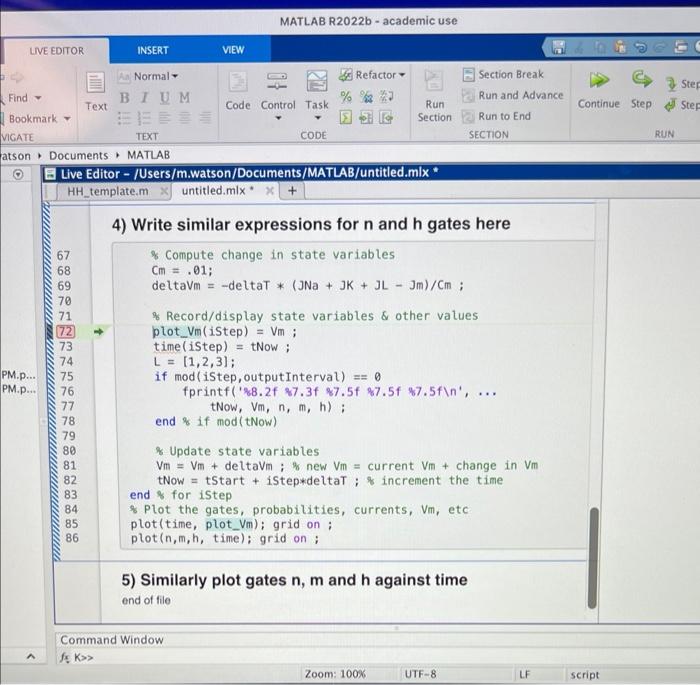
4) Write similar expressions for \( \mathrm{n} \) and \( \mathrm{h} \) gates here \& Compute change in state variables \( \mathrm{Cm}=.01 ; \) \( \operatorname{deltaVm}=-\operatorname{deltaT} *(\mathrm{JNa}+\mathrm{JK}+\mathrm{JL}-\mathrm{Jm}) / \mathrm{Cm} ; \) \% Record/display state variables \& other values \( p \) lot \( V m( \) iStep \( )= \) Vm ; time \( ( \) istep \( )= \) tNow ; \( \mathrm{L}=[1,2,3] \) if \( \bmod ( \) istep, outputInterval) \( ==0 \) fprintf( \%8.2f \( 87.3 f \$ 7.5 f \$ 7.5 f \% 7.5 f \backslash n^{\prime}, \ldots \) tNow, \( \mathrm{Vm}, \mathrm{n}, \mathrm{m}, \mathrm{h}) \); end of if mod (tNow) \% Update state variables \( V_{m}=V_{m}+ \) deltaVm; o new \( V_{m}= \) current \( V_{m}+ \) change in \( V_{m} \) tNow = tStart + iStep*deltaT; is increment the time end is for istep s Plot the gates, probabilities, currents, Vm, etc plot(time, plot_Vm); grid on ; \( p \cot (n, m, h \), time \( ) \); grid on ;
Expert Answer
Hi, As per the error ,you need to pre-allocate space to the tables A and B. Re-allocation is not an error.It is only a warning.The speed of the code i