(Solved): Calculating marginal revenue from a linear demand curveThe blue curve on the following graph represe ...
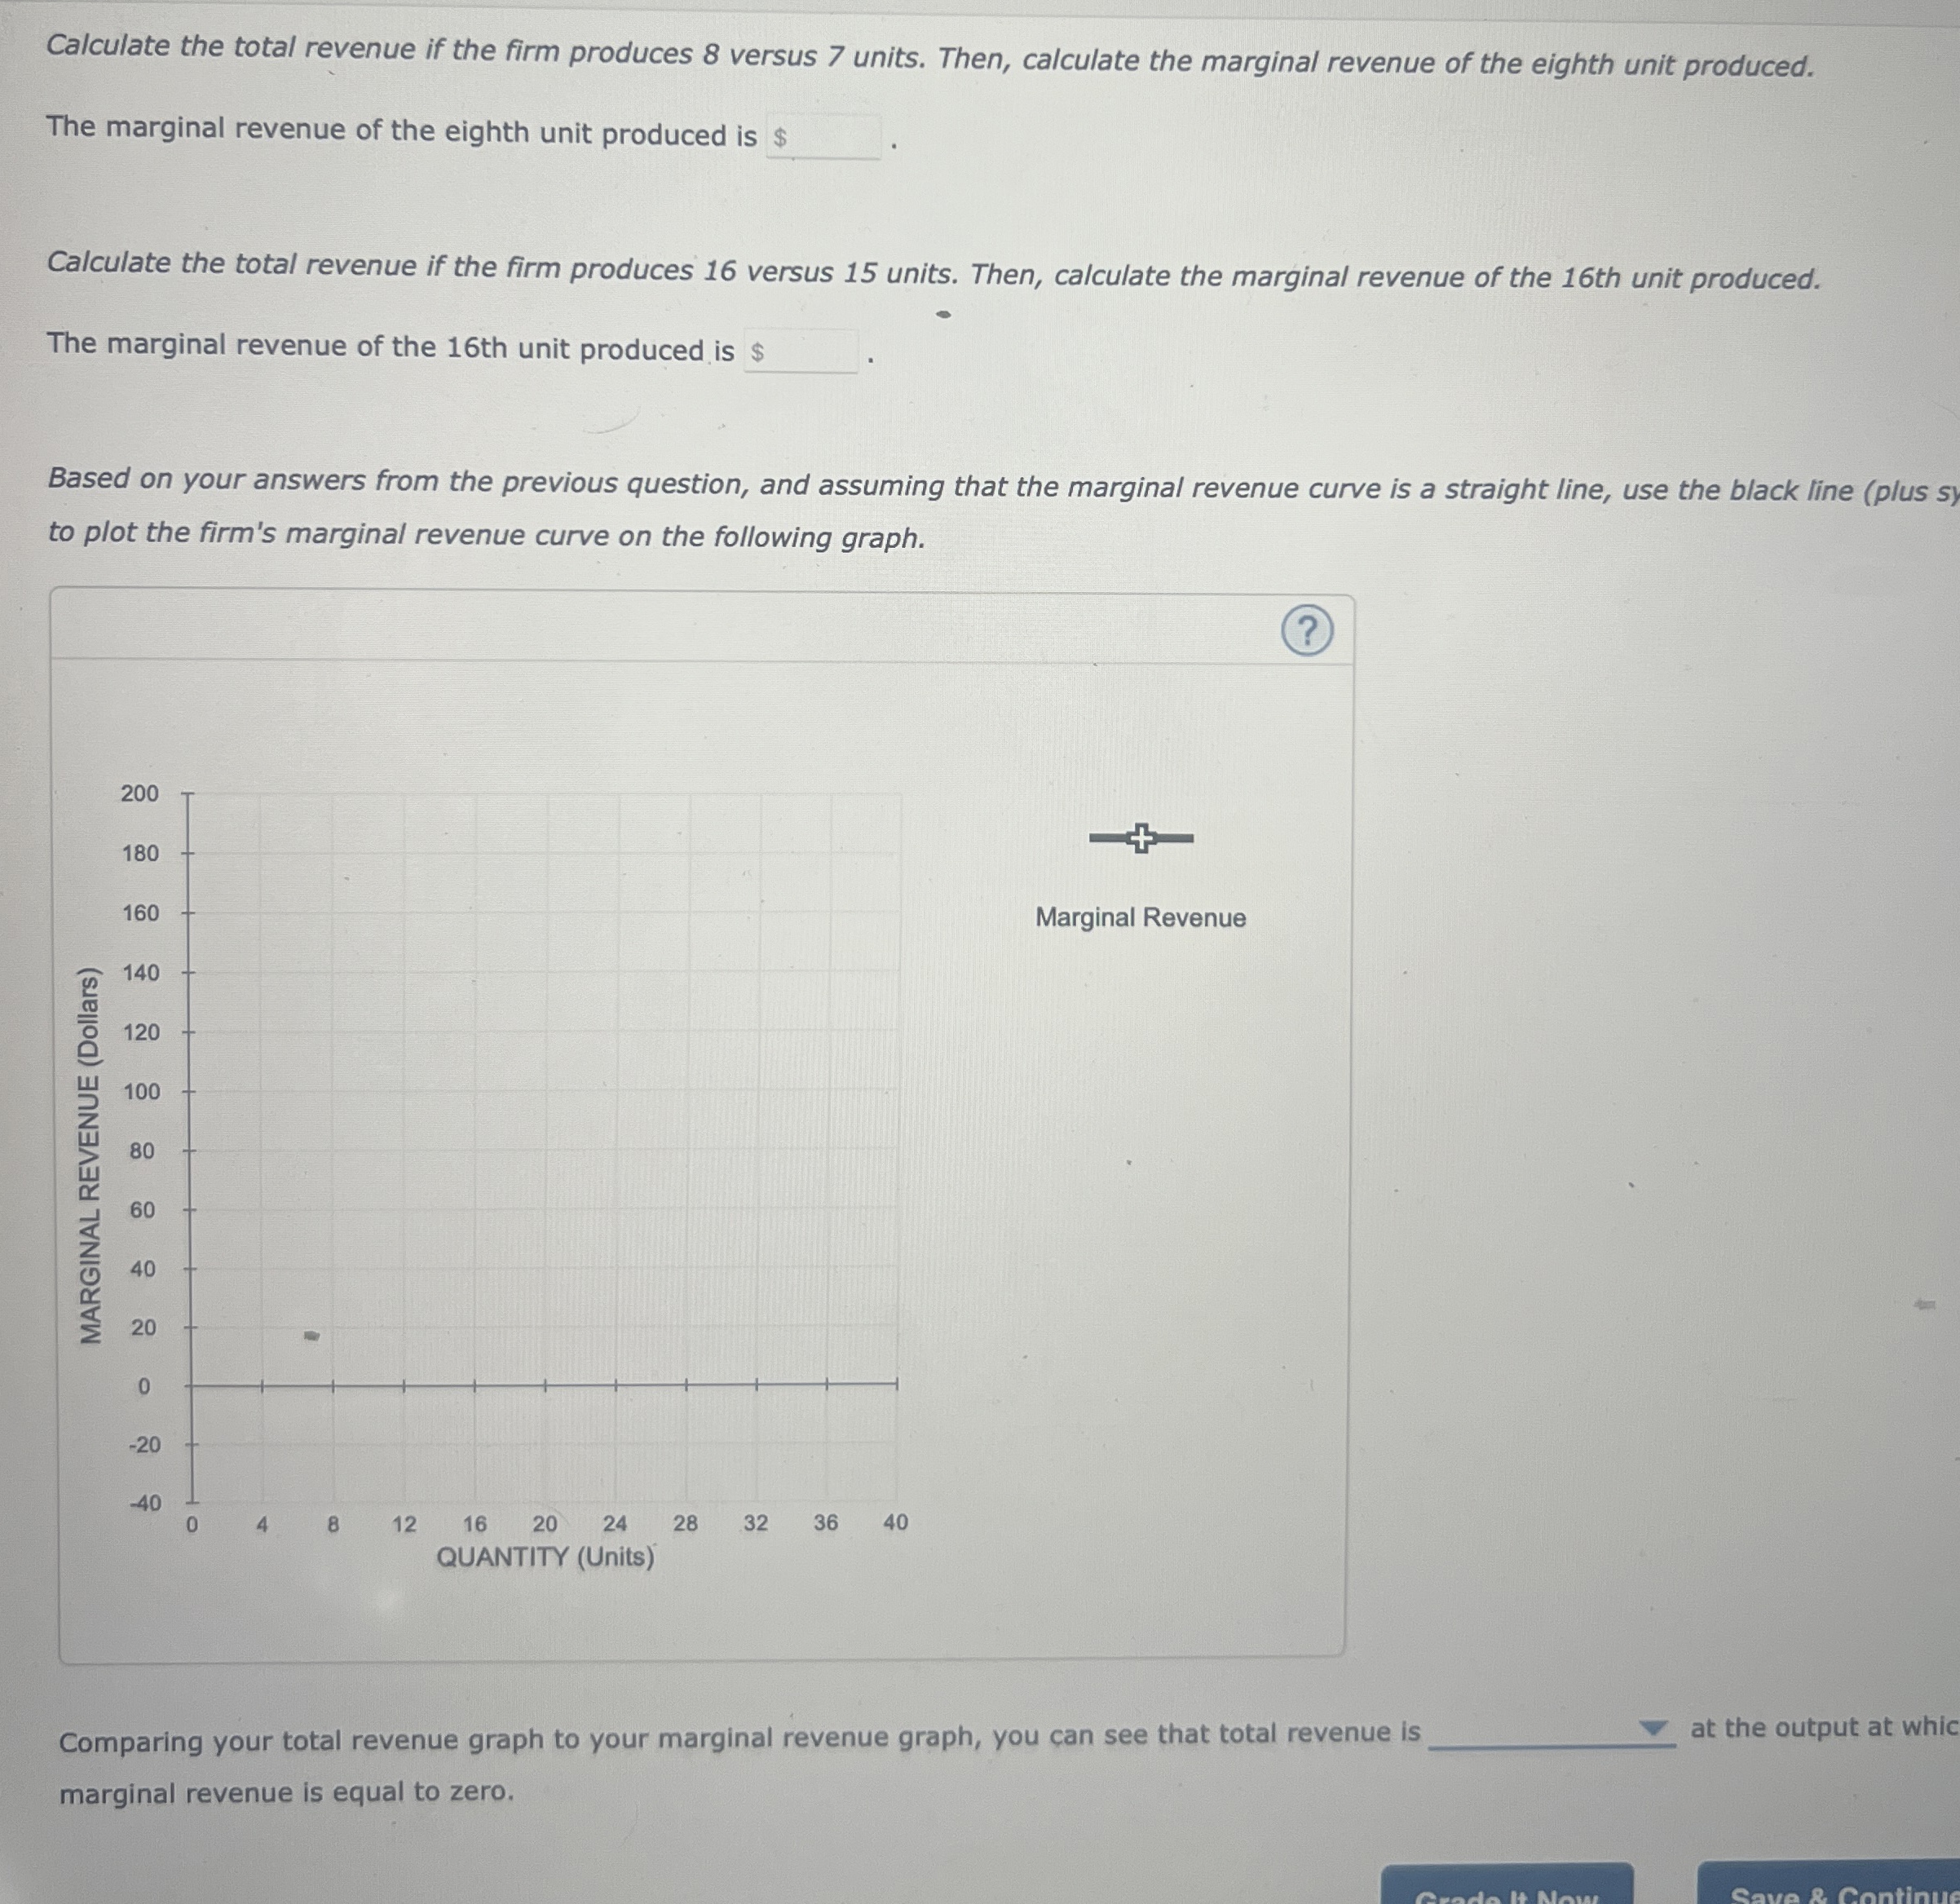
Calculating marginal revenue from a linear demand curveThe blue curve on the following graph represents the demand curve facing a firm that can set its own prices.Use the graph input tool to help you answer the following questions. You will not be graded on any changes you make to this graph.Note: Once you enter a value in a white field, the graph and any corresponding amounts in each grey field will change accordingly.0481216202428323640200180160140120100806040200PRICE (Dollars per unit)QUANTITY (Units)Demand Graph Input ToolMarket for Goods Quantity Demanded(Units) Demand Price(Dollars per unit) On the graph input tool, change the number found in the Quantity Demanded field to determine the prices that correspond to the production of 0, 8, 16, 20, 24, 32, and 40 units of output. Calculate the total revenue for each of these production levels. Then, on the following graph, use the green points (triangle symbol) to plot the results.Total Revenue04812162024283236402000180016001400120010008006004002000TOTAL REVENUE (Dollars)QUANTITY (Number of units)Calculate the total revenue if the firm produces 8 versus 7 units. Then, calculate the marginal revenue of the eighth unit produced.The marginal revenue of the eighth unit produced is.Calculate the total revenue if the firm produces 16 versus 15 units. Then, calculate the marginal revenue of the 16th unit produced.The marginal revenue of the 16th unit produced is.Based on your answers from the previous question, and assuming that the marginal revenue curve is a straight line, use the black line (plus symbol) to plot the firm's marginal revenue curve on the following graph.Marginal Revenue0481216202428323640200180160140120100806040200-20-40MARGINAL REVENUE (Dollars)QUANTITY (Units)Comparing your total revenue graph to your marginal revenue graph, you can see that total revenue is at the output at which marginal revenue is equal to zero.