Home /
Expert Answers /
Anatomy and Physiology /
below-is-a-graph-showing-three-oxygen-saturation-curves-labeled-a-b-and-c-the-vertical-axis-is-t-pa700
(Solved): Below is a graph showing three oxygen saturation curves labeled A, B and C. The vertical axis is t ...
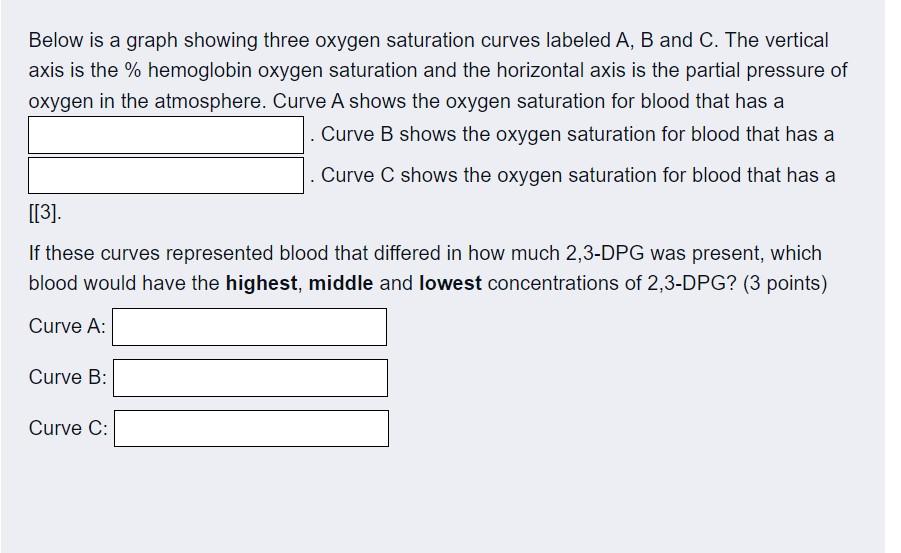
Below is a graph showing three oxygen saturation curves labeled A, B and C. The vertical axis is the % hemoglobin oxygen saturation and the horizontal axis is the partial pressure of oxygen in the atmosphere. Curve A shows the oxygen saturation for blood that has a . Curve B shows the oxygen saturation for blood that has a . Curve C shows the oxygen saturation for blood that has a [[3]. If these curves represented blood that differed in how much 2,3-DPG was present, which blood would have the highest, middle and lowest concentrations of 2,3-DPG? (3 points) Curve A: Curve B: Curve C:
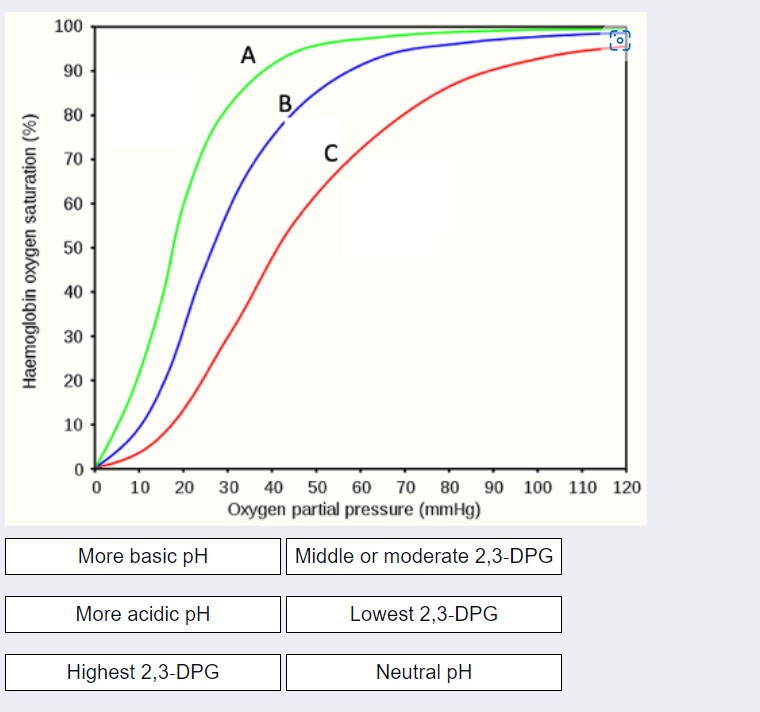
Haemoglobin oxygen saturation (%) 100 90 80 70 60 50 40 30 20 10 0 0 More basic pH More acidic pH A 10 20 30 40 50 60 70 80 90 100 110 120 Oxygen partial pressure (mmHg) Highest 2,3-DPG B C Middle or moderate 2,3-DPG Lowest 2,3-DPG Neutral pH
Expert Answer
Curve A shows the oxygen saturation for blood that has a More Basic pH Curve B shows oxygen