Home /
Expert Answers /
Advanced Math /
below-is-a-graph-representing-part-of-the-cross-section-of-mount-arbour-the-y-axis-represents-the-pa225
(Solved): Below is a graph representing part of the cross-section of Mount Arbour. The y-axis represents the ...
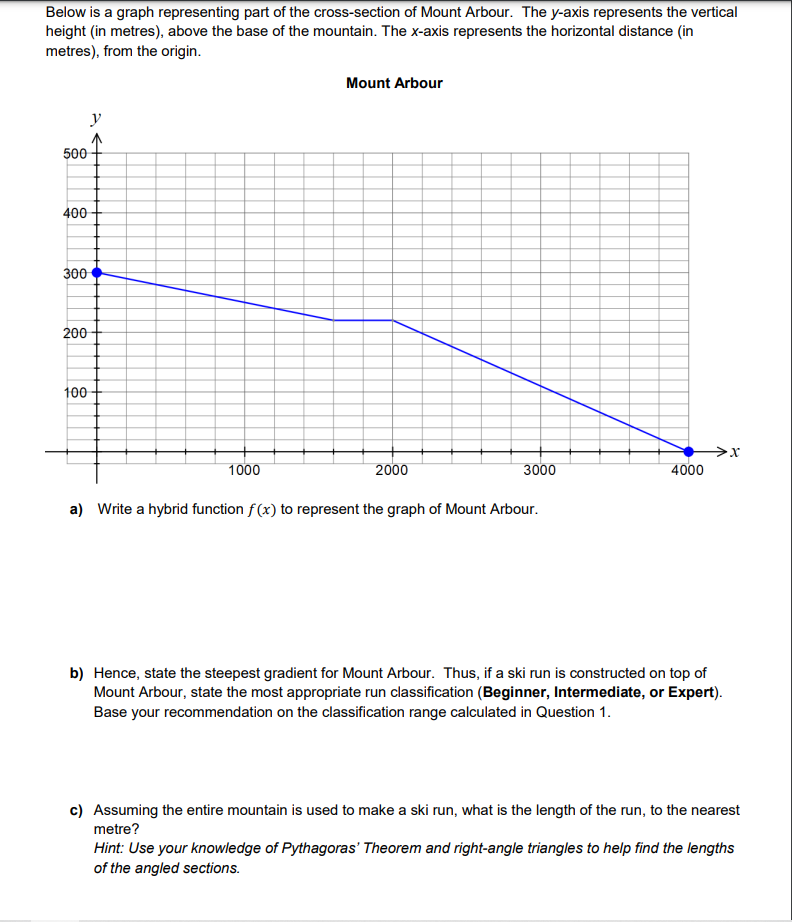
Below is a graph representing part of the cross-section of Mount Arbour. The y-axis represents the vertical height (in metres), above the base of the mountain. The x-axis represents the horizontal distance (in metres), from the origin. Mount Arbour y 500 400 300 200 100 X 1000 2000 3000 4000 a) Write a hybrid function f(x) to represent the graph of Mount Arbour. b) Hence, state the steepest gradient for Mount Arbour. Thus, if a ski run is constructed on top of Mount Arbour, state the most appropriate run classification (Beginner, Intermediate, or Expert). Base your recommendation on the classification range calculated in Question 1. c) Assuming the entire mountain is used to make a ski run, what is the length of the run, to the nearest metre? Hint: Use your knowledge of Pythagoras' Theorem and right-angle triangles to help find the lengths of the angled sections.
Expert Answer
ANSWER- (a) (b) Steepest gradient = 11% Beginn