Home /
Expert Answers /
Statistics and Probability /
b-o-the-null-hypothesis-of-independence-of-the-two-classifications-a-and-b-as-shown-on-the-3x3-con-pa535
(Solved): B O The null hypothesis of independence of the two classifications A and B as shown on the 3x3 con ...
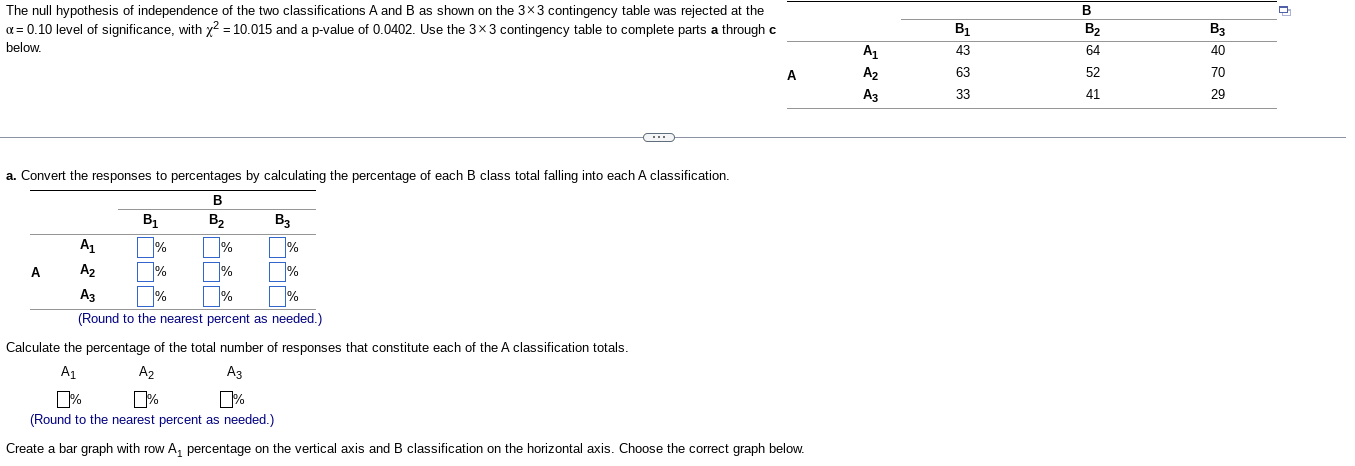
B O The null hypothesis of independence of the two classifications A and B as shown on the 3x3 contingency table was rejected at the a=0.10 level of significance, with y2 = 10.015 and a p-value of 0.0402. Use the 3 x 3 contingency table to complete parts a through c below. B2 Bi 43 B3 40 AL 64 ? Az 63 52 70 A3 33 41 29 a. Convert the responses to percentages by calculating the percentage of each B class total falling into each A classification. B A 1% B B? B3 A1 % % % Az % % A3 % % % (Round to the nearest percent as needed.) Calculate the percentage of the total number of responses that constitute each of the A classification totals. A1 A2 ?? (Round to the nearest percent as needed.) Create a bar graph with row A, percentage on the vertical axis and B classification on the horizontal axis. Choose the correct graph below.